
Blog
What Is Revenue Operations (RevOps)? Definition, Responsibilities, and Core Metrics
Revenue operations (RevOps) defined for B2B SaaS: what the function owns, the metrics the board asks for, frameworks, and a first-hire 90-day plan.
How the time decay attribution model is calculated, how to pick a half-life, when it beats last-touch or linear, and when a hybrid fits a long B2B SaaS cycle.
 Ishan ManchandaNov 6, 2026

Revenue operations (RevOps) defined for B2B SaaS: what the function owns, the metrics the board asks for, frameworks, and a first-hire 90-day plan.

Touchpoint analysis shows which buyer interactions move B2B SaaS deals forward. Pair it with conversion funnel analysis to get past last-touch bias.

UTM tagging explained for B2B SaaS: the five parameters, a naming structure for paid campaigns, and the three points where UTM data is lost before the CRM.
Request a quote and our experts will contact you within 24 hours with tailored solutions and pricing.
Last updated: Nov 6, 2026
By the RevOps for B2B SaaS Editorial Team | Last reviewed: November 4, 2026 (newest source cited: August 2026)
The time decay attribution model is a multi-touch method that gives each marketing touchpoint credit based on how close it occurred to the conversion, so recent touches earn more and earlier touches earn less. For B2B SaaS, that sounds right. Deals take months, and the touches nearest the close feel decisive.
The catch is what the model hides. Dreamdata's 2026 benchmark puts the average B2B journey at 272 days (PPC Land, reporting Dreamdata, 2026). Over that span, a recency weight can quietly erase the touches that created demand. This guide covers the formula, a worked example, how to choose a half-life, and when a hybrid fits better. For the wider model landscape, see the attribution models pillar.
Key Takeaways
- The time decay attribution model weights each touchpoint by recency using the formula 2 raised to negative t over the half-life, then normalizes weights to 100%.
- The half-life setting decides the result: a 7-day half-life behaves almost like last-touch on a long B2B SaaS cycle, while 30 to 60 days spreads credit more evenly.
- Time decay beats last-touch on multi-touch deals, but it undervalues early demand creation and cannot credit touches that were never tracked.
- Google Analytics 4 retired time decay in November 2023, so it must be rebuilt in a warehouse, a CRM or an attribution platform.
- A hybrid works best for long cycles: time decay for in-funnel optimization, first-touch or W-shaped for sourcing, and budget floors for demand creation.
The time decay attribution model is a multi-touch method that gives more credit to touchpoints closer to the conversion. It suits B2B SaaS, where Dreamdata's 2026 benchmark measured an average journey of 272 days (PPC Land, reporting Dreamdata, 2026). It shrinks credit for early demand creation, so a hybrid often fits better.

Marketing Ops and revenue operations (RevOps) teams usually reach for time decay when last-touch attribution feels too blunt. Last-touch attribution is a method that gives 100% of the credit to the final touchpoint before conversion. Time decay keeps the logic that late touches matter but pays earlier touches something too.
Time decay works well when three conditions hold:
It fits badly when the main decision is how much to spend on early demand creation. It also fits badly when deals have few tracked touches, because a weighting scheme cannot spread credit it never sees.
The time decay formula gives each touchpoint a raw weight of 2 raised to the power of negative t divided by the half-life, where t is the days between the touch and the conversion. Weights are then normalized to total 100% and each touch receives that share of the deal amount. Many tools default to a seven-day half-life (Demandspring, 2026).

The half-life is the number of days over which a touchpoint's credit falls by half. A touch on the conversion day has a raw weight of 1. A touch one half-life earlier has 0.5, and a touch two half-lives earlier has 0.25.
The numbers below are illustrative arithmetic, not research findings. Take one hypothetical $100,000 closed-won deal with four touches, 90, 60, 30 and 7 days before close. Each raw weight is 2^(-t/half-life), rounded to three decimals.
| Touch (days before close) | 7-day half-life | 30-day half-life | 60-day half-life |
|---|---|---|---|
| 90 days (first touch) | 0.000 | 0.125 | 0.354 |
| 60 days | 0.003 | 0.250 | 0.500 |
| 30 days | 0.050 | 0.500 | 0.707 |
| 7 days (last touch) | 0.500 | 0.851 | 0.922 |
| Sum of raw weights | 0.553 | 1.726 | 2.483 |
To get a touch's credit, divide its raw weight by the column sum and multiply by $100,000. With a 7-day half-life, the last touch gets 0.500 / 0.553, about 0.904 of the deal, or roughly $90,400. That is last-touch with a small tail. With a 60-day half-life, the first touch gets 0.354 / 2.483, about 0.142 of the deal, or roughly $14,200. Same journey, very different story.
At opportunity level, the same weights work like this:
A B2B SaaS team should set the time decay half-life from its own sales cycle rather than defaulting to seven days. Published practitioner guidance disagrees: Trackingplan recommends 14 to 30 days for B2B (Trackingplan, 2026), while Demandspring suggests 30 to 60 days for a six-month cycle (Demandspring, 2026).

Both are practitioner opinions, not studies. Trackingplan matches the half-life to the median time to conversion, and recommends 3 to 5 days for e-commerce. It also warns that a 14-day half-life still compresses too much credit into the last two weeks of a 60-day cycle. Demandspring warns that a mismatched half-life produces last-touch results in disguise, so treat that as a risk, not a certainty.
| Source | Suggested half-life | Context | Type |
|---|---|---|---|
| Trackingplan (2026) | 14 to 30 days | B2B | Vendor guidance |
| Demandspring (2026) | 30 to 60 days | Six-month B2B cycle | Practitioner guidance |
| Trackingplan (2026) | 3 to 5 days | E-commerce | Vendor guidance |
Your own median should override any published range.
Dreamdata's 2026 report measured 272 days, 88 touchpoints and 10 stakeholders, up from 211 days, 76 touchpoints and 6.8 stakeholders a year earlier (PPC Land, reporting Dreamdata, 2026), as the chart shows; Dreamdata is an attribution vendor, so treat this as vendor research.
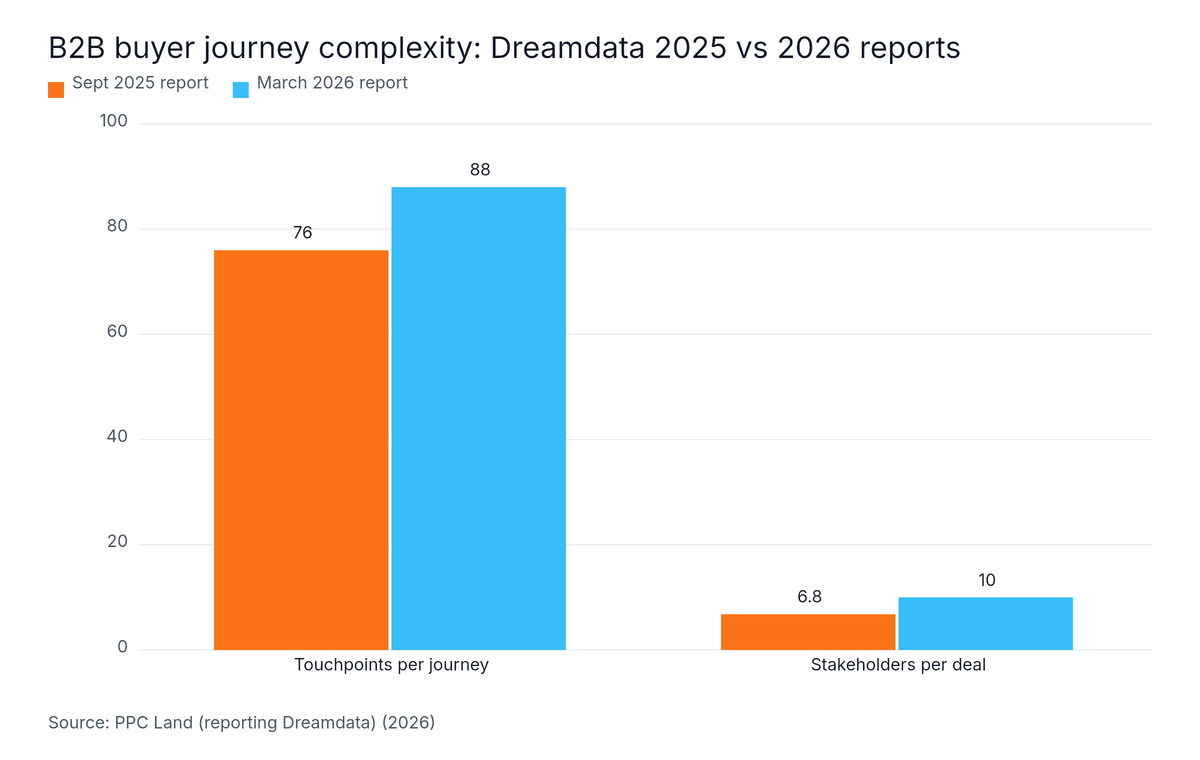
Source: PPC Land (reporting Dreamdata), 2026
Time decay attribution outperforms last-touch when a deal has many touches over weeks or months, because it rewards late touches but still credits earlier nurturing. It beats linear attribution, which splits credit equally, when recent touches truly drive the close. Last-touch stays reasonable for short cycles: 53.5% of marketers in a 2026 Ruler Analytics survey called it somewhat effective (Ruler Analytics, 2026).
The survey did not show its sample size, so read it as a sign that last-touch is not useless, not as proof. The practical contrast looks like this:
| Situation | Better fit | Reason |
|---|---|---|
| Short cycle, one buyer, few touches | Last-touch | Little credit left to spread |
| Multi-month cycle, several tracked touches | Time decay | Rewards nurture and closing touches |
| Every touch seen as equally important | Linear | Neutral baseline, no recency bias |
| Many buyers, untracked early research | Hybrid | Neither model sees the early touches |
The last-touch breakdown covers where that model fails. Linear is also a useful check: run it beside time decay, and a large gap between the two shows how much the recency weighting is moving credit.
What we found: In GrowthSpree's June 2026 audit of 104 Google Ads accounts, 91% had no Google click ID (GCLID) reaching the customer relationship management (CRM) system, and 89% ran default attribution. After a 90-day attribution fix, the share of closed-won deals traced to a campaign went from 0% to 67%.
Attribution only works on touches the CRM can see. Fix click ID capture before tuning a half-life.
Yes, time decay attribution undervalues early demand creation, because its weights shrink with every day before the conversion. Early brand touches may also never be tracked. In 6sense's 2025 research, the winning vendor was still on the Day One shortlist 95% of the time (6sense, 2025), and no recency weighting can credit that.

Kerry Cunningham, Head of Research at 6sense, put the stakes this way: "You must become the preferred vendor during Selection." (Bizibl, 2025)
Ty Heath of the LinkedIn B2B Institute makes the same point about memory: "If you're not on their mind, you're not on the list." (Closed Loop, 2025) Those early impressions rarely show up in a CRM touch table.
Buyers are also moving further from CRM-logged touches. Gartner's May 2026 release (645 buyers) reports 67% of B2B buyers prefer a rep-free experience and 70% prefer fully digital self-service (Gartner, 2026). More of the journey sits outside the data.
The fix is to stop treating the time decay output as the whole story. Add a self-reported "how did you hear about us" field. Hold budget floors for early programs. Never cut top-of-funnel spend because it scores low under a recency model.
No, Google Analytics 4 (GA4) no longer offers time decay attribution. As of August 2026 it provides three models: data-driven, paid and organic last click, and Google paid channels last click (Mar-Sci, 2026). Time decay was retired in November 2023, so teams must build it in a warehouse such as BigQuery, in a CRM or in an attribution platform.

Some older guides still describe time decay as a GA4 setting. That is out of date. This account of the retirement rests on one secondary source, Mar-Sci, which also lists first click, linear and position-based among the retired models. Confirm it against Google's own documentation before changing a reporting setup.
| Where to build it | What you need | Best for |
|---|---|---|
| Warehouse (BigQuery) | Touch table with dates, SQL for the formula | Teams with analytics engineering |
| CRM reporting | Touch records tied to opportunities | Teams with clean opportunity stages |
| Attribution platform | Connected ad, web and CRM data | Teams without warehouse skills |
The marketing attribution software guide lists what to check before buying a platform. For model definitions across the board, the marketing attribution models overview goes through each type.
Run linear or W-shaped credit on the same deals. W-shaped attribution is a multi-touch method that gives the largest shares of credit to first touch, lead creation and opportunity creation. If the models agree on the top campaigns, confidence is high. If they disagree, test with holdouts, incrementality tests or self-reported answers.
Time decay attribution is the wrong primary model in three cases: early-touch spend is large, most deals lack a clean opportunity stage, or buying groups are large. Dreamdata's 2026 benchmark counts 10 stakeholders per deal (PPC Land, reporting Dreamdata, 2026). A hybrid usually replaces it, pairing time decay for in-funnel optimization with first-touch or W-shaped credit and budget floors for demand creation.
Hybrid attribution is the practice of running two or more attribution views together and using each for the decision it suits. Use these decision rules:
| Signal | Lean toward | Why |
|---|---|---|
| Cycle of a few weeks, one buyer | Last-touch or time decay | Few touches to weigh |
| Cycle of several months | Time decay with a long half-life, plus first-touch | Recency alone hides sourcing |
| Many deals lack an opportunity stage | Linear or first-touch for now | Time decay needs dated stage data |
| Large share of spend on early programs | Hybrid with budget floors | Protects demand creation |
| Ten-person buying groups | Account-level credit | Contact-level touches miss the group |
This is not a fit for teams with no CRM touch data, for very short cycles, or for anyone who needs to prove brand impact. Time decay also treats the journey as one person's, while buying groups are large. Credit at the account or buying-group level where the data allows.
Conversion rates by stage also vary by channel, which affects how you read any model. See the B2B SaaS sales conversion benchmarks for ranges.
The time decay attribution formula sets each touchpoint's raw weight to 2 raised to the power of negative t divided by the half-life, where t is the number of days between the touch and the conversion. Weights are then normalized to total 100%, and each touch receives its share of the deal amount.
No, Google Analytics 4 no longer offers time decay attribution. As of August 2026 it provides three models: data-driven, paid and organic last click, and Google paid channels last click. Time decay was retired in November 2023, so teams must rebuild it from the BigQuery export, in a CRM or in an attribution platform.
Time decay attribution shares credit across every touchpoint, weighted by how recently each occurred, while last-touch attribution gives 100% of the credit to the final touch before conversion. A time decay model with a very short half-life behaves almost like last-touch, so the half-life setting decides how different the two results are.
Use time decay attribution instead of linear attribution when recent touches plausibly drive the close and the cycle is long enough for timing to matter. Linear attribution splits credit equally across all touches, which suits teams that see every touch as equally important or want a neutral baseline to compare against.
Time decay attribution and W-shaped attribution suit different decisions. Time decay suits in-funnel campaign optimization because it rewards recent touches, while W-shaped attribution credits first touch, lead creation and opportunity creation, which makes it better for sourcing and budget decisions. Many B2B SaaS teams run both and compare the results.
Yes, time decay attribution can be combined with first-touch or other multi-touch models in a hybrid. A common design uses time decay to optimize campaigns inside the funnel and first-touch or W-shaped credit to track sourcing, with budget floors that protect early demand-creation programs from being cut.
The time decay attribution model is a useful lens for long B2B SaaS cycles, as long as it is not the only lens. Keep these points:
If your team is deciding which model fits its stage and data, bring the CRM and reporting question to a free consultation: Meet with an expert.
Written by
Ishan Manchanda
Ishan Manchanda is co-founder of GrowthSpree, a B2B SaaS marketing consultancy founded in 2017 that has managed $60M+ in ad spend across 300+ B2B SaaS companies. He focuses on demand generation, go-to-market strategy and pipeline growth, and has been featured in Silicon Valley Times, SaaS Mag and the Unbounce podcast.
© 2026 revopsforb2bsaas.com All rights reserved.