
Blog
RevOps Roles and Titles: What Each Person on a Revenue Operations Team Actually Does
Revenue operations roles mapped by title: what a specialist, analyst, manager, director and head of RevOps each own across CRM, attribution and forecasting.
Calculate SaaS LTV for B2B SaaS with cohort, gross margin and NRR adjustments, a worked example, and how to use LTV in CAC and budget decisions.
 Ishan ManchandaNov 9, 2026

Revenue operations roles mapped by title: what a specialist, analyst, manager, director and head of RevOps each own across CRM, attribution and forecasting.

Revenue operations (RevOps) defined for B2B SaaS: what the function owns, the metrics the board asks for, frameworks, and a first-hire 90-day plan.

How the time decay attribution model is calculated, how to pick a half-life, when it beats last-touch or linear, and when a hybrid fits a long B2B SaaS cycle.
Request a quote and our experts will contact you within 24 hours with tailored solutions and pricing.
Last updated: Nov 9, 2026
By RevOps for B2B SaaS Editorial Team. Last updated: November 4, 2026.
SaaS LTV calculation is the process of estimating the gross profit a B2B SaaS customer will generate over the life of the account, usually by dividing margin-adjusted revenue per account by a churn rate. The formula is simple. Trusting it is harder.
In ChartMogul's analysis of 35,512 customer cohorts, 28.3% had actual revenue that differed from the predicted LTV by more than 50% (ChartMogul, 2026). That gap matters because LTV sets acquisition cost thresholds and pipeline targets, which feed the attribution decisions that revenue operations (RevOps) owns. This guide shows how to calculate LTV, split it by cohort, handle net revenue retention above 100%, and use it in budget decisions.
Key Takeaways
- SaaS LTV is ARPA × gross margin ÷ churn rate in its basic form, and ChartMogul calls that basic formula "overly optimistic".
- A blended LTV hides segment differences: ChartMogul found 74% of the cheapest signup-MRR quartile still active after 12 months, against 45% of the most expensive (ChartMogul, 2026).
- When net revenue retention is above 100%, the churn-based LTV formula breaks, so a B2B SaaS team should use a capped 24 to 36 month cohort horizon.
- LTV for B2B SaaS budget decisions should be compared with fully loaded CAC by segment and paired with CAC payback.
Customer lifetime value (LTV) is the gross profit a customer account is expected to generate before it churns. The basic B2B SaaS formula is ARPA × gross margin ÷ churn rate, but ChartMogul warns that "The basic LTV formula produces an overly optimistic result." (ChartMogul, 2026). Treat it as a starting estimate, then adjust it.

Revenue-based LTV ignores the cost of serving the account, so it overstates profit whenever gross margin is below 100%. Apply the same margin assumption in every segment so comparisons stay fair.
| Input | Definition | Typical source |
|---|---|---|
| ARPA | Monthly recurring revenue ÷ paying accounts | Billing system |
| Gross margin | (Subscription revenue − cost of delivery) ÷ subscription revenue | Finance |
| Revenue churn | Recurring revenue lost to cancellations and contraction per month | Billing system |
| Fully loaded CAC | Sales, marketing, onboarding and customer success cost to win one account | Finance and customer relationship management (CRM) |
Calculating SaaS LTV for a B2B SaaS company requires five inputs: average revenue per account, gross margin, a churn rate, a cohort definition and a fully loaded customer acquisition cost (CAC). Gross revenue retention (GRR) is the cleanest churn source, and Aleph's 2026 benchmark shows median GRR fell from 88% to 84% (Aleph, 2026).
Aleph's commentary on its 2026 report puts the trend plainly: "Median GRR fell to 84% in 2025, down from 90% just three years prior." (Aleph, 2026). Any LTV built on an older churn assumption is likely too high.
| Field | Where it lives | Owner |
|---|---|---|
| Start date and plan type (monthly or annual) | Billing system | Finance |
| Contract value at signup (ACV) | CRM closed-won record | RevOps |
| Segment, price tier and industry | CRM account record | RevOps |
| Acquisition channel and campaign | CRM, tied to the Google click ID (GCLID) or equivalent | RevOps and Marketing Ops |
| Expansion and contraction by month | Billing system | Finance |
| Onboarding and customer success cost | General ledger | Finance |
The channel field is the one most teams are missing. A 2026 audit of 104 Google Ads accounts published by GrowthSpree found 91% had no Google click ID reaching the CRM (GrowthSpree, June 2026). Without that link, LTV cannot be joined to the channel that produced the customer.
The basic SaaS LTV formula overstates value because it blends customers with different retention into one average. In ChartMogul's analysis of 35,512 cohorts, 28.3% had actual revenue that differed by more than 50% from the LTV predicted at formation (ChartMogul, 2026). Churn assumptions also go stale quickly.

ChartMogul's dataset covers 3,331 company accounts from Q1 2020 to Q4 2024. LTV was calculated at cohort formation from blended ARPA and trailing six-month logo churn, then compared with actual revenue. The median error moved from -2.4% at 12 months to +6.9% at 24 months and +14.4% at 36 months (ChartMogul, 2026). The formula errs one way early and the other way later, so one point-in-time LTV is unreliable.
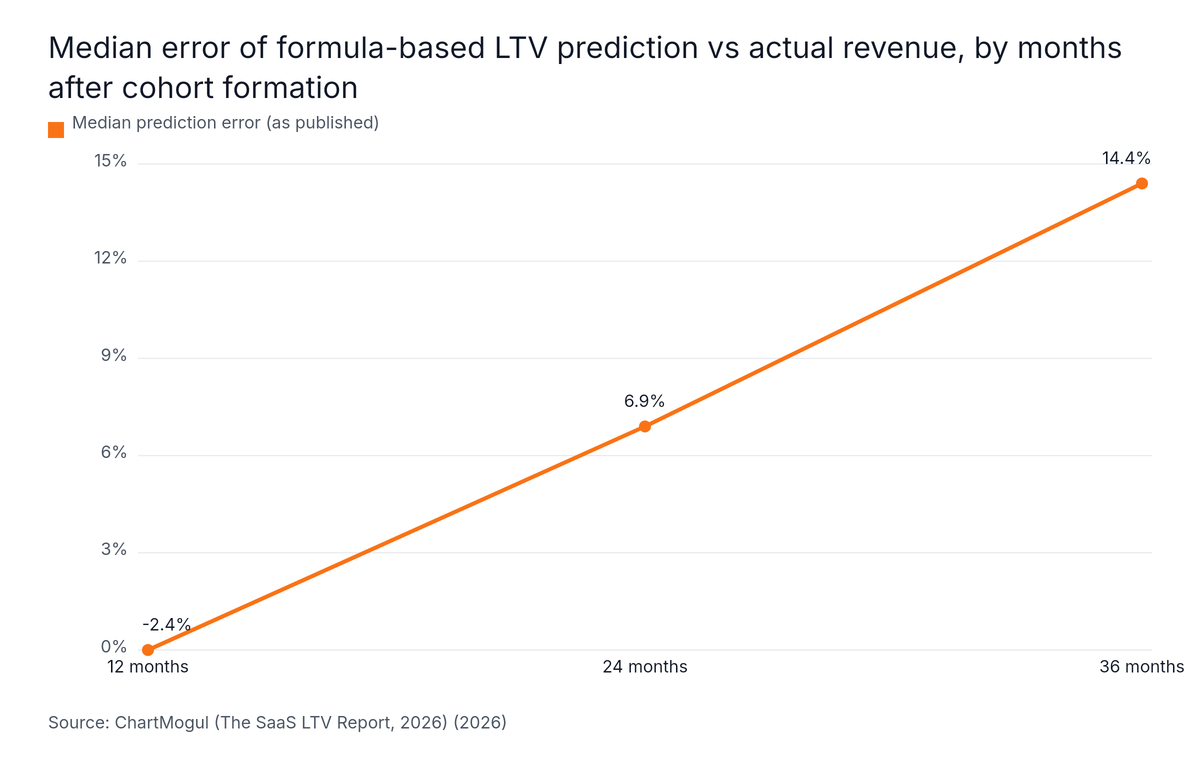
Source: ChartMogul (The SaaS LTV Report, 2026), 2026
Cohort LTV is the LTV calculated separately for a group of customers who share a signup period, price tier, plan type or acquisition channel. ChartMogul found 74% of the cheapest signup-MRR quartile were still active after 12 months, against 45% of the most expensive quartile (ChartMogul, 2026).

The report's author summarises the pattern: "Lower-paying customers often survive longer than higher-paying ones" (ChartMogul, 2026). A blended LTV therefore tends to overvalue high-priced segments.
The inputs below are hypothetical round numbers chosen to show the arithmetic. They are an illustration, not benchmarks. Both cohorts assume an 80% gross margin and the same CAC. The blended column is revenue-weighted: total MRR ÷ total accounts for ARPA, and (A MRR × A churn + B MRR × B churn) ÷ total MRR for churn.
| Metric (illustrative) | Cohort A (low price) | Cohort B (high price) | Blended |
|---|---|---|---|
| Paying accounts | 50 | 10 | 60 |
| Monthly recurring revenue | $20,000 | $20,000 | $40,000 |
| ARPA | $400 | $2,000 | $667 |
| Monthly revenue churn | 2% | 4% | 3% |
| LTV (ARPA × 0.8 ÷ churn) | $16,000 | $40,000 | about $17,800 |
| Fully loaded CAC | $6,000 | $6,000 | $6,000 |
Divide each LTV by its CAC. Cohort A recovers its acquisition cost less than three times over. Cohort B recovers it more than six times over. The blended figure lands close to three times, which looks acceptable. Yet Cohort A holds most of the accounts and sits below that line. A budget set on the blended figure would treat both cohorts the same, and would misprice every channel that feeds only one of them.
Net revenue retention (NRR) is the share of a cohort's starting recurring revenue still billed after churn, contraction and expansion. When NRR is above 100%, the churn-based LTV formula breaks because the implied lifetime has no end. Use a capped 24 to 36 month horizon of realised cohort revenue instead. Median NRR was 102% in 2025 data (Aleph, 2026).

Use realised revenue where it exists and a stated projection only for the months that have not happened yet. The cap keeps expansion from inflating LTV without limit.
Benchmarks differ because the samples differ. Pick peers by pricing model, deal size and stage.
| Source | Population | Median NRR |
|---|---|---|
| Aleph x Benchmarkit, 2026 | 342 B2B SaaS and AI-native companies, self-reported (230 reported NRR) | 102% |
| SaaS Capital, 2026 | Bootstrapped private B2B SaaS, $3M to $20M annual recurring revenue (ARR) | 103% (GRR 91%) |
| ChartMogul, December 2025 | About 2,700 B2B SaaS companies, billing data | 82% |
The first two are survey medians. The third comes from billing records. The benchmark you choose changes the LTV you defend to the board.
Aleph's 2026 benchmark puts usage-based companies at 108% median NRR and seat-based companies at 98% (Aleph, 2026).
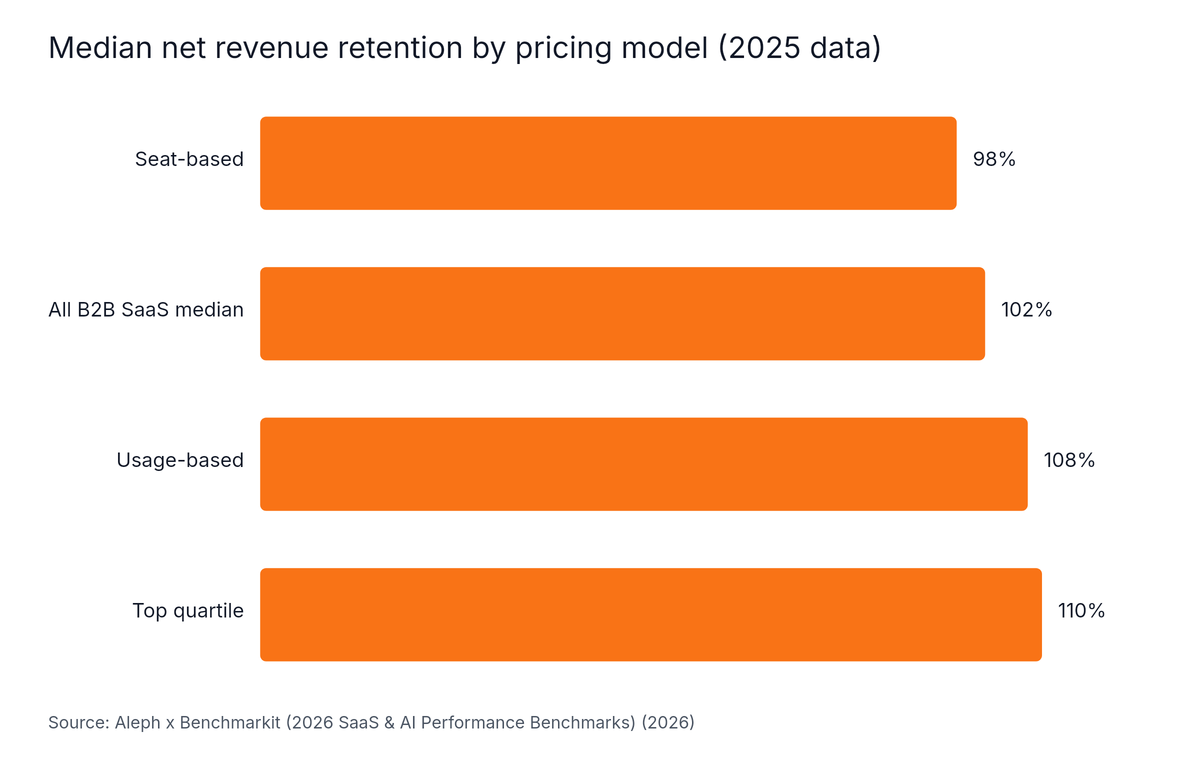
Source: Aleph x Benchmarkit (2026 SaaS & AI Performance Benchmarks), 2026
For bootstrapped companies, SaaS Capital reports median GRR of 91% and NRR of 103%, with the 90th percentile at 100% GRR and 117.9% NRR (SaaS Capital, 2026). Use these to sanity-check your own inputs.
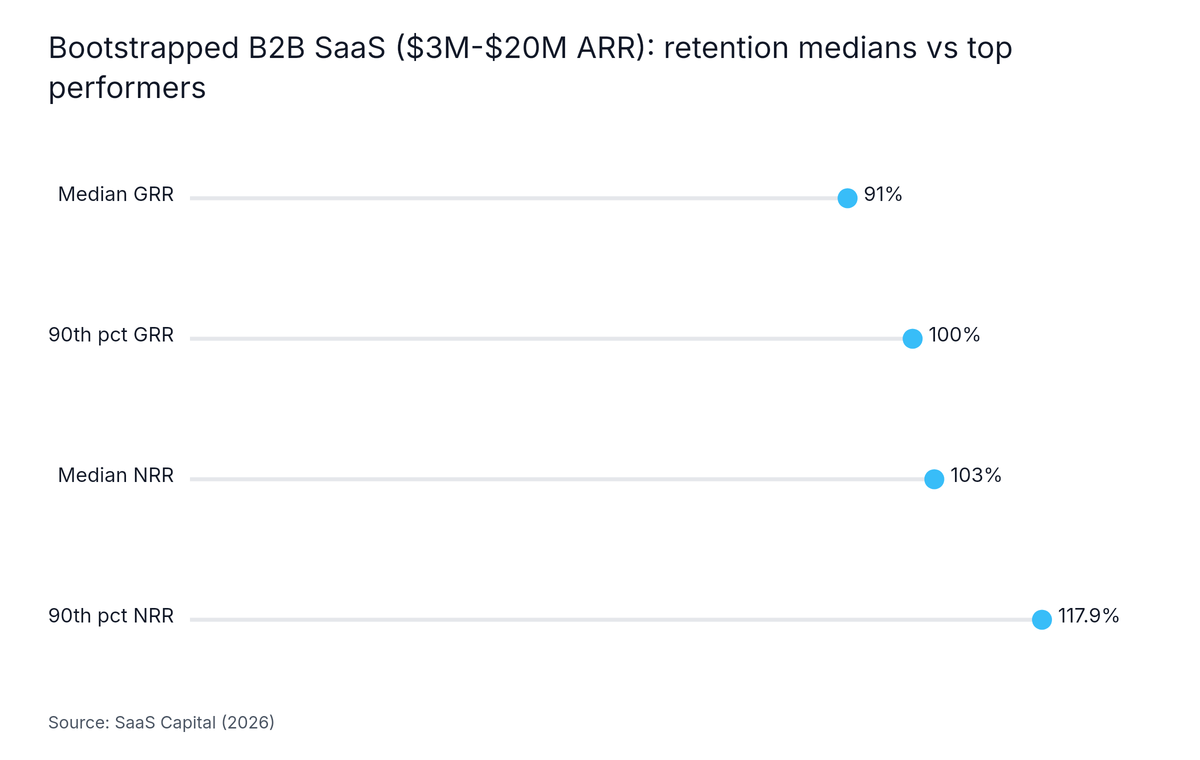
Source: SaaS Capital, 2026
LTV informs attribution and budget by setting the ceiling on what each channel or segment can pay to acquire a customer. A blended LTV applied to every channel hides weak segments, so compare segment LTV to fully loaded CAC and lead with CAC payback, which Aleph reports improved from 18 months to 16 months at the median (Aleph, 2026).

CAC payback is the number of months of gross profit needed to recover the cost of acquiring a customer. LTV:CAC is the ratio of lifetime gross profit to acquisition cost. Payback is measured, while LTV:CAC is a projection. For cohorts under 12 months old, lead with payback.
A channel-level LTV:CAC is only as good as the attribution behind it. If last-touch attribution gives branded search credit for deals other channels created, the channel CAC is wrong and so is the ratio.
Audit data (GrowthSpree, June 2026, 104 audited Google Ads accounts): 91% had no Google click ID reaching the CRM and 89% ran default attribution. After a 90-day attribution fix, the share of closed-won deals traced to a campaign went from 0% to 67%.
Review the attribution software options once click IDs and stages reach the CRM.
The cohort and capped-horizon LTV method suits B2B SaaS teams with at least 12 months of billing history. Teams with younger cohorts should lead with CAC payback and show LTV:CAC only as a projection, the practitioner position in 2026 trade commentary (Mostly Metrics, 2026).
No single LTV:CAC ratio is reliable for every B2B SaaS company, because the ratio is a projection built on churn assumptions that go stale. ChartMogul's 2026 cohort analysis found predictions often miss actual revenue by wide margins (ChartMogul, 2026). Pair the ratio with CAC payback and review it by segment.
LTV for B2B SaaS should be based on gross margin, not revenue, because revenue ignores the cost of serving the customer. A revenue-based figure overstates profit whenever gross margin is below 100%. Use subscription gross margin and keep the same margin assumption in every segment comparison so the ratios stay fair.
LTV for B2B SaaS should use revenue churn, ideally gross revenue retention (GRR), because logo churn treats a small account and a large account as equal. Median GRR fell from 88% to 84% in Aleph's 2026 benchmark (Aleph, 2026). Use logo churn only as a secondary check when revenue data is unavailable.
A B2B SaaS company with less than 12 months of data should lead with CAC payback and show LTV:CAC only as a projection, the practitioner position in 2026 trade commentary (Mostly Metrics, 2026). Use realised gross margin per account, state the churn assumption openly, and replace it with measured cohort retention once 12 months of billing history exist.
Median net revenue retention for B2B SaaS ranges from 82% to 103% depending on the dataset. Aleph's 2026 survey reports 102% (Aleph, 2026), SaaS Capital reports 103% for bootstrapped companies (SaaS Capital, 2026), and ChartMogul's billing data shows 82% (ChartMogul, 2025). Pick peers by pricing model, deal size and stage.
SaaS LTV works as a decision input only when it is built by cohort, adjusted for gross margin and tested against realised revenue. The takeaways:
One funnel. One set of definitions. One number everyone trusts. To work through your LTV inputs, CRM fields and attribution setup with a RevOps expert, Meet with an expert.
Written by
Ishan Manchanda
Ishan Manchanda is co-founder of GrowthSpree, a B2B SaaS marketing consultancy founded in 2017 that has managed $60M+ in ad spend across 300+ B2B SaaS companies. He focuses on demand generation, go-to-market strategy and pipeline growth, and has been featured in Silicon Valley Times, SaaS Mag and the Unbounce podcast.
© 2026 revopsforb2bsaas.com All rights reserved.