
Blog
Time Decay Attribution Model: What It Is and When to Use It in B2B SaaS
How the time decay attribution model is calculated, how to pick a half-life, when it beats last-touch or linear, and when a hybrid fits a long B2B SaaS cycle.
Revenue operations (RevOps) defined for B2B SaaS: what the function owns, the metrics the board asks for, frameworks, and a first-hire 90-day plan.
 Ishan ManchandaNov 6, 2026

How the time decay attribution model is calculated, how to pick a half-life, when it beats last-touch or linear, and when a hybrid fits a long B2B SaaS cycle.

Touchpoint analysis shows which buyer interactions move B2B SaaS deals forward. Pair it with conversion funnel analysis to get past last-touch bias.

UTM tagging explained for B2B SaaS: the five parameters, a naming structure for paid campaigns, and the three points where UTM data is lost before the CRM.
Request a quote and our experts will contact you within 24 hours with tailored solutions and pricing.
revopsforb2bsaas.com
Last updated: Nov 6, 2026
By the RevOps for B2B SaaS Editorial Team. Last updated: November 4, 2026.
Revenue operations (RevOps) is the function that aligns marketing, sales and customer success around one funnel, one set of stage definitions and one set of metrics, so every team reports the same numbers. The need shows up fast. In 104 audited Google Ads accounts, 78% of form fills never became a sales-qualified lead (SQL) (GrowthSpree, June 2026). Marketing counts one thing, sales counts another, and the board gets two decks. This guide defines the function for B2B SaaS, maps what it owns and lists the metrics a board expects. It also points to deeper pages, such as the RevOps reporting dashboard guide.
Key Takeaways
- Revenue operations is the B2B SaaS function that runs the systems, data, processes and reporting behind marketing, sales and customer success.
- A RevOps function owns customer relationship management (CRM) data, stage definitions, lead routing, attribution, forecasting and board reporting.
- Median B2B SaaS CAC payback was 16 months and median gross revenue retention was 84% on 2025 data (Aleph x Benchmarkit, 2026).
- B2B SaaS benchmarks disagree because samples differ, so a RevOps team must pick a comparison set before it reports a number.
- A first RevOps hire should audit for 30 days, then fix CRM data, routing and pipeline reporting before scoring, forecasting or AI.
Revenue operations is the B2B SaaS function that runs the systems, data, processes and reporting behind marketing, sales and customer success, so all three teams work from one funnel. It covers the whole customer lifecycle: on average, 73% of B2B revenue comes from existing customers (Forrester, 2025).

Revenue operations is a single operating function that owns the funnel from first touch to renewal. It replaces three separate sets of tools, reports and definitions with one. Most marketing teams still focus mainly on acquisition, which is why retention and expansion belong inside RevOps scope.
Stage terms need plain definitions from the start. A marketing-qualified lead (MQL) is a lead that meets a written score or firmographic threshold. A sales-qualified lead (SQL) is a lead that sales has accepted against written criteria. A lifecycle stage is the position of a record in the funnel, set by a buyer action rather than a seller's opinion.
Sales operations supports the sales team, and marketing operations supports campaigns and lead data. RevOps spans both and adds customer success.
| Function | Primary scope | Typical items it owns |
|---|---|---|
| Sales ops | Sales team support | CRM hygiene, territory design, quota setting |
| Marketing ops | Campaign infrastructure | Lead scoring, attribution, campaign tracking |
| RevOps | Full funnel, first touch to renewal | One stage model, one reporting layer, forecasting, routing, retention reporting |
A deeper comparison belongs on its own page. This guide stays on the function as a whole.
There is no single route. The usual path looks like this:
Hiring options matter here too. The consultant versus internal hire comparison covers when each makes sense.
The core responsibilities of a revenue operations function are CRM and data management, stage and process design, lead routing, attribution and reporting, forecasting, and technology administration across marketing, sales and customer success. In B2B SaaS, the function also owns the pipeline and retention numbers the board reviews, and it keeps every team on the same stage definitions.

| Responsibility | What it covers | Why it matters |
|---|---|---|
| Data and CRM hygiene | Required fields, dedupe rules, ownership | Reports are only as good as the records |
| Stage and process design | Entry criteria for each lifecycle stage | Ends the "400 leads versus 30 real" argument |
| Lead routing | Assignment by segment, alerts, response-time targets | Paid leads go cold in a queue |
| Attribution and reporting | Source tracking, click IDs, pipeline by source | Budget follows what the CRM can see |
| Forecasting | Commit criteria, stage probabilities, accuracy tracking | Finance plans headcount on the forecast |
| Technology administration | Integrations, access, vendor setup | Tools stay connected and documented |
Process and data quality are the weak spots in most teams. Forrester's Revenue Operations Survey (2024) found that 49% of revenue operations leaders believe their processes are not flexible enough to respond quickly when conditions change (Forrester, 2025). The same page reports that 38% of leaders name data lacking accuracy and quality among data users' top challenges. The page does not state the sample size.
The clearest example is the click ID. The Google click ID (GCLID) is a parameter Google Ads attaches to a clicked ad URL so a later conversion can be matched to the click. Without it in the CRM, a closed-won deal cannot be traced back to a campaign.
What we found: In GrowthSpree's June 2026 audit of 104 Google Ads accounts ($78.0M in spend), 91% had no GCLID reaching the CRM and 89% ran default attribution. After a 90-day attribution fix, the share of closed-won deals traced to a campaign went from 0% to 67%.
Google moved custom offline uploads to the Data Manager API from June 15, 2026. Any setup needs a current check against Google's documentation. Attribution theory is covered in the guide to attribution models in B2B marketing. The stack that carries this data is covered in the revenue operations software guide.
A revenue operations team tracks metrics in three layers: board metrics such as net revenue retention (NRR), gross revenue retention (GRR) and CAC payback, funnel metrics such as MQL to SQL conversion and pipeline coverage, and process metrics such as lead response time and forecast accuracy. Median B2B SaaS CAC payback was 16 months on full-year 2025 data (Aleph x Benchmarkit, 2026).
Every metric needs a formula, an owner and a source system. A board rarely hears a number once before asking where it came from.
| Metric | Formula in plain words | Suggested owner | Benchmark and source |
|---|---|---|---|
| CAC payback | Months of gross margin needed to recover acquisition cost | Finance with RevOps | 16 months median, 342 B2B SaaS and AI-native companies, 2025 data (Aleph x Benchmarkit, 2026) |
| Gross revenue retention | Starting recurring revenue kept after churn and downgrades | Customer success with RevOps | 84% median, 226 reporting companies (Aleph x Benchmarkit, 2026) |
| Net revenue retention | Recurring revenue from existing customers, including expansion, over starting revenue | Customer success with RevOps | 103% median, bootstrapped $3M to $20M ARR (SaaS Capital, 2026) |
| MQL to SQL rate | SQLs created over MQLs created in a period | Marketing ops | 26% paid search, 30% LinkedIn, 51% SEO (First Page Sage, 50+ clients, updated June 2025) |
| Pipeline coverage | Open pipeline value over the revenue target |
Net revenue retention (NRR) is recurring revenue from existing customers a year later, including expansion and churn, as a share of what they paid at the start. Gross revenue retention (GRR) is the same measure as net revenue retention with expansion excluded. CAC payback is the number of months of gross margin from a new customer needed to recover the cost of acquiring them. Pipeline coverage is the ratio of open pipeline value to the revenue target for the same period. Track it by stage, not only in aggregate.
Median B2B SaaS gross revenue retention fell 4 points to 84% in 2025, down from 88% (Aleph x Benchmarkit, 2026). The spread is wide. The bottom quartile sat at 76% and the top quartile at 91% in the same dataset (Aleph x Benchmarkit, 2026).
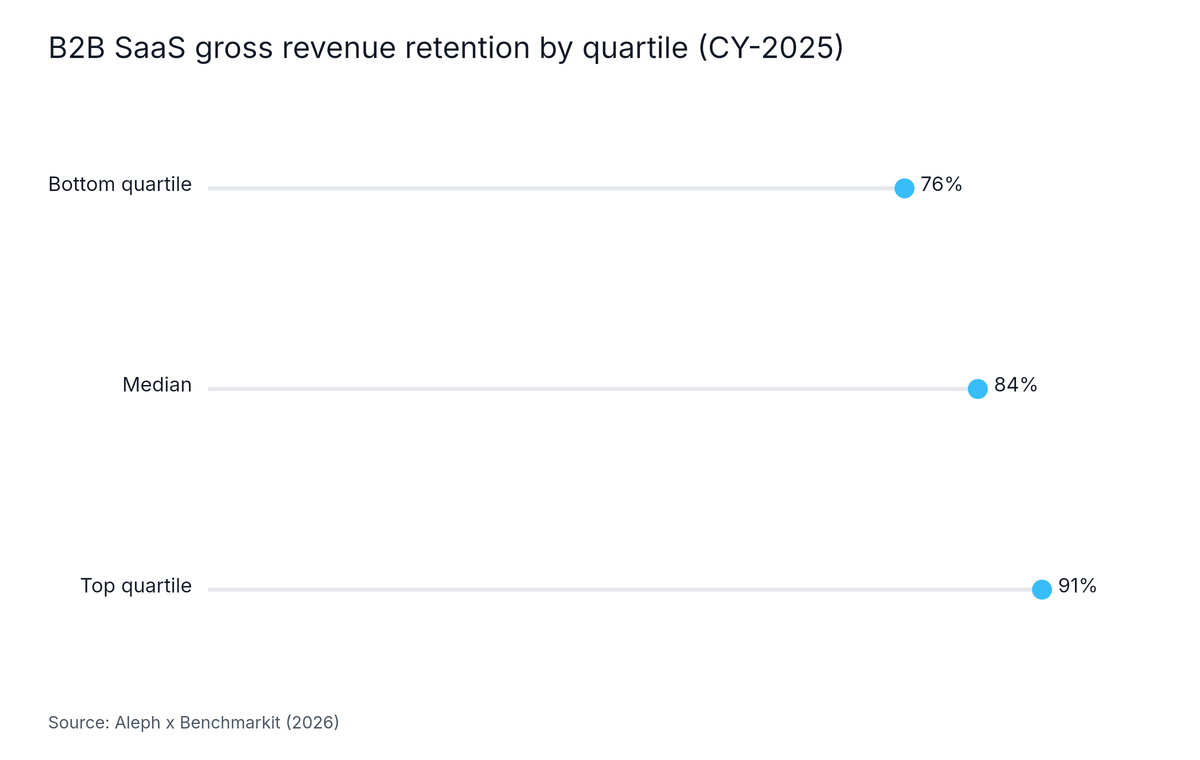
Source: Aleph x Benchmarkit, 2026
Go-to-market motion explains part of the gap. Sales-led companies held 88%, hybrid companies 80% and product-led companies 79% (Aleph x Benchmarkit, 2026).
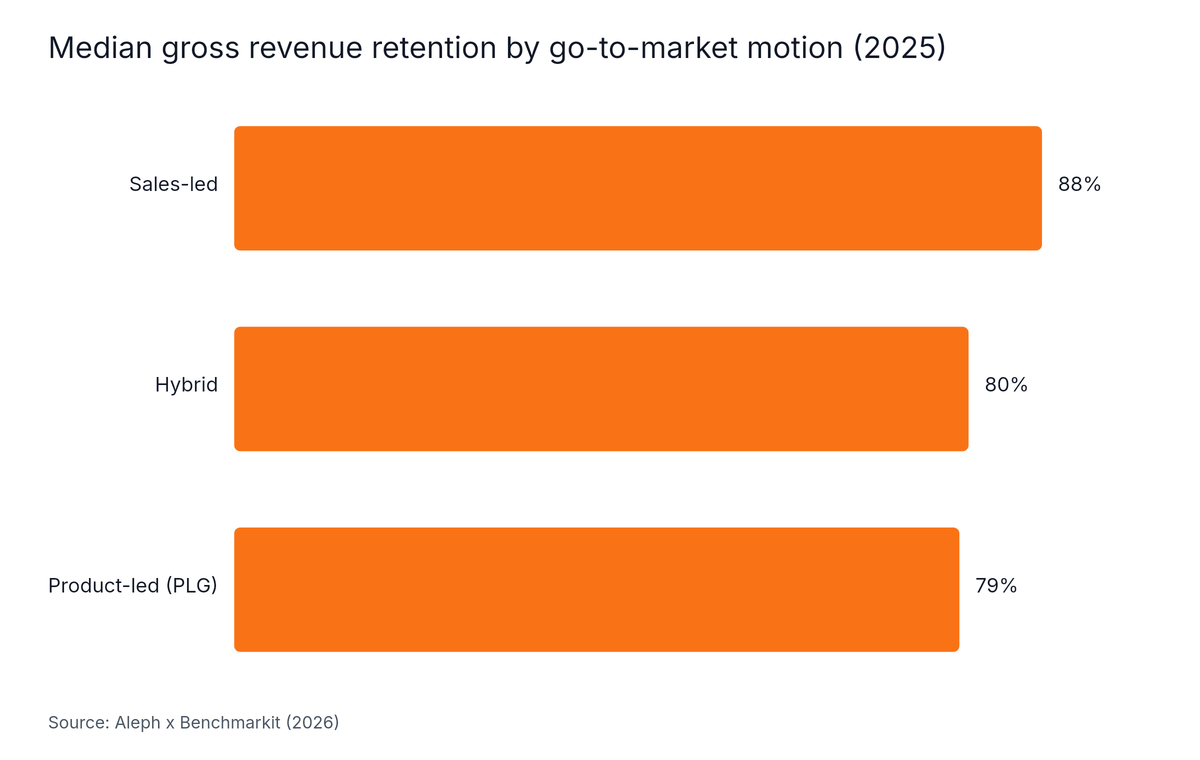
Source: Aleph x Benchmarkit, 2026
SaaS Capital reports median GRR of 91% for bootstrapped private SaaS companies with $3M to $20M ARR, a 90th percentile of 100% and median revenue growth of 15% (SaaS Capital, 2026). The same segment reports median NRR of 103% (SaaS Capital, 2026). That 91% is higher than the 84% from Aleph x Benchmarkit because the samples differ in funding model, ARR band and go-to-market motion.
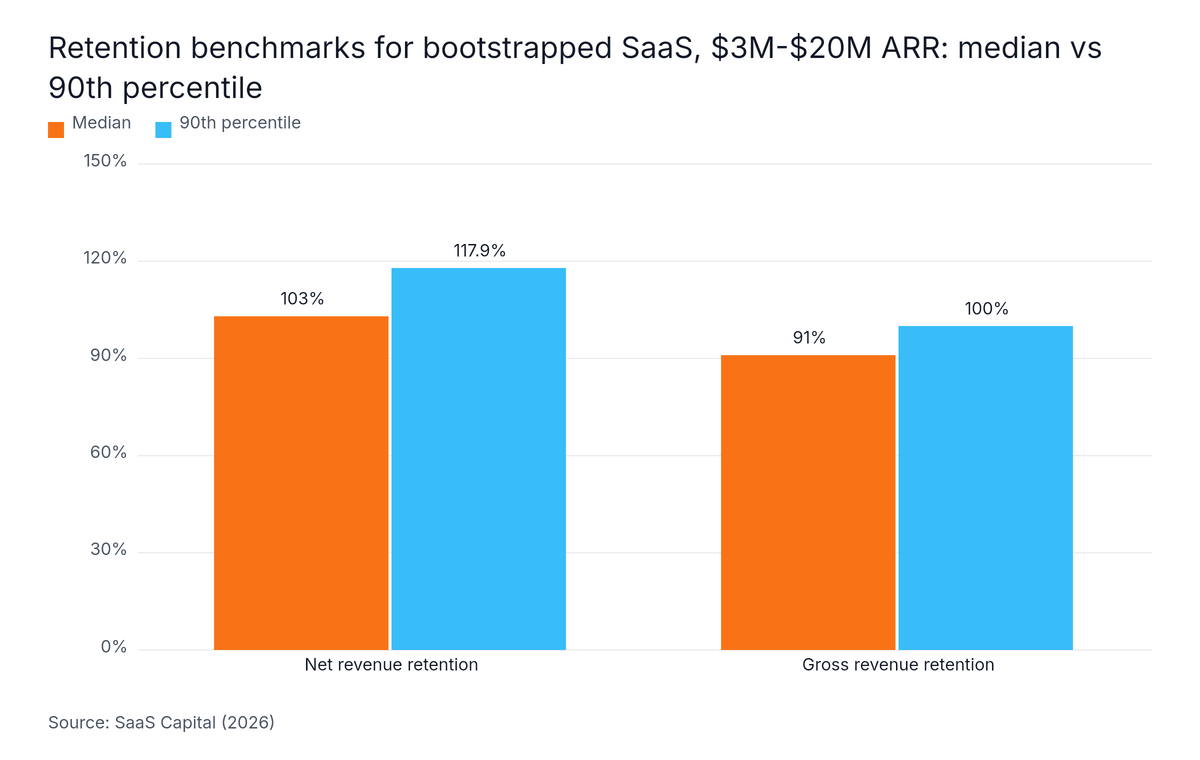
Source: SaaS Capital, 2026
The rule for a RevOps team is simple. Pick a comparison set that matches the company's funding, size and motion, and write it next to the metric. Never average two sources that define their samples differently.
Funnel numbers are best compared by channel and by source. The two MQL to SQL sources define stages separately, so they are shown side by side and never averaged.
| Measure | Value | Source |
|---|---|---|
| MQL to SQL, paid search | 26% | First Page Sage, 50+ clients, updated June 2025 |
| MQL to SQL, LinkedIn | 30% | First Page Sage, 50+ clients, updated June 2025 |
| MQL to SQL, SEO | 51% | First Page Sage, 50+ clients, updated June 2025 |
| MQL to SQL, B2B SaaS Google Ads (median) | 13% to 18% | GrowthSpree, April 2026 |
| Cost per SQL, Google Ads (published median) | $800 to $2,500 | GrowthSpree, April 2026 |
| Correlation of cost per SQL with pipeline | 0.71 | GrowthSpree, June 2026, 1,412 ad variants in 96 accounts |
| Correlation of click-through rate with pipeline | 0.09 | GrowthSpree, June 2026, 1,412 ad variants in 96 accounts |
| Marketing spend as share of ARR (median) | 8% | SaaS Capital, June 2026, 1,000+ companies |
| Sales spend as share of ARR (median) | 15% | SaaS Capital, June 2026, 1,000+ companies |
In GrowthSpree's June 2026 study of 1,412 ad variants, cost per SQL tracked pipeline far better than click-through rate. The dashboard that shows these numbers together is described in the RevOps reporting dashboard guide.
The revenue operations frameworks that work best for B2B SaaS start with one written stage model, then adjust priorities by company stage and go-to-market motion. Sales-led companies held median gross revenue retention of 88% in 2025, versus 80% for hybrid and 79% for product-led growth (PLG) (Aleph x Benchmarkit, 2026), so the motion shapes which metrics matter.

A stage model is a written list of lifecycle stages, each with an entry criterion tied to a buyer action. A workable B2B SaaS model has these steps:
What we found: In GrowthSpree's June 2026 audit of 104 Google Ads accounts, 78% of form fills never became a sales-qualified lead. Counting form fills as leads is the usual cause of the "400 leads versus 30 real" argument.
Review the criteria whenever conversion rates drift. Boards test this model first, since budgets are judged on pipeline.
Practitioner views on sequencing agree on a pattern. They are blog guidance, not research (The RevOps Report, 2026).
| Company stage | Focus first | Defer |
|---|---|---|
| Seed to Series A | Stage definitions, CRM data, routing, one trusted pipeline report | Advanced scoring, complex territories |
| Series A to Series B | Attribution, forecasting categories, board metric dictionary | Heavy tooling that no one owns |
| Series B and later | Retention and expansion reporting, data governance, team structure | Rebuilding the CRM without an audit |
Attribution choices belong in the framework too. Published ranges with no stated sample or source method rate single-model attribution at 38% to 58% accuracy, and a hybrid of multi-touch, self-reported and branded search lift at 82% to 92%. Treat these as opinion. The practical step is to add a "how did you hear about us" field. See last-touch attribution for where single-touch reports break.
A revenue operations guide for a first RevOps hire covers when to hire, what to fix first and what to defer. Practitioner consensus in 2026 is a 30-day audit, then CRM data, routing and trusted pipeline reporting, then scoring and forecasting, with strategic projects starting around months 4 to 6 (The RevOps Report, 2026).

Most B2B SaaS companies hire around Series A. The usual triggers are:
| Window | Work | Output |
|---|---|---|
| Days 1 to 30 | Audit CRM fields, stages, routing and reports, and interview each team | Written findings and a list of conflicting definitions |
| Days 31 to 60 | Fix required fields, stage criteria, routing rules and click-ID capture | One stage model and a working routing setup |
| Days 61 to 90 | Build the shared pipeline report and start tracking forecast accuracy | One report both teams accept |
Practitioner guidance puts strategic projects at months 4 to 6. Reporting lines remain an open question. Practitioners disagree on whether RevOps should report to the CRO, CFO or COO, and no verified data here settles it. Pick the line that keeps the function neutral between marketing and sales.
The core revenue operations best practices for a first RevOps hire are to write one stage model, fix CRM data and routing, report pipeline from one source of truth, tie ad spend to closed-won revenue, and fix data before adding AI. In a May 2026 vendor survey of 123 practitioners (a small sample, so directional), 73% had an AI mandate but only 38% had the data to support it (Revenue Wizards, 2026).

Fix the data first. In the same Revenue Wizards survey of 123 practitioners (May 2026), 56% of companies with an AI mandate run AI on fragmented data (Revenue Wizards, 2026). Read both figures as directional. A separate Everstage and UserEvidence survey of 424 senior RevOps professionals found only 9% are fully AI-native, while 91% say AI was worth the investment (Everstage, 2026).
Forrester puts the leadership task this way: "Revenue operations must steer the vision by purposefully applying AI across GTM processes to reap the promised rewards." (Forrester, 2025). Gartner predicts AI agents will outnumber sellers 10 to 1 by 2028 (Gartner, 2026). That raises the stakes on data governance. Tool choices are covered in the marketing attribution software guide.
Revenue operations is a poor fit for B2B SaaS companies with no sales team and no CRM yet, and for B2C, direct-to-consumer or e-commerce businesses, where a spreadsheet and a written process come first. Even inside B2B SaaS, 49% of revenue operations leaders say their processes are not flexible enough to respond quickly (Forrester, 2025), so a title alone fixes nothing.
Sometimes, in practice. A title change without a change in scope is a rebrand. The real difference is scope: one owner for the funnel from first touch to renewal, one stage model, and one reporting layer used by marketing, sales and customer success. If the role only supports the sales team, it is sales ops.
Revenue operations (RevOps) is the function that aligns marketing, sales and customer success around a shared funnel, one set of stage definitions and one set of metrics. In B2B SaaS it owns CRM setup, attribution, lead routing, forecasting, and the pipeline and retention metrics the board asks for.
The frameworks that work best in B2B SaaS begin with one written stage model, then adapt priorities to company stage and go-to-market motion. Early teams fix CRM data, routing and pipeline reporting first. Later teams add scoring and forecasting. Sales-led, hybrid and product-led companies also need different retention benchmarks.
A RevOps team tracks board metrics (net revenue retention, gross revenue retention, CAC payback), funnel metrics (MQL to SQL conversion, pipeline coverage, cost per SQL) and process metrics (lead response time, forecast accuracy). Each metric needs a written formula, a named owner and a source system.
The core responsibilities of a RevOps function are CRM and data management, stage and process design, lead routing, attribution and reporting, forecasting, and technology administration. The function serves marketing, sales and customer success, and it keeps all three teams reporting from the same definitions.
A RevOps guide for a first hire covers when to hire, a 30-day audit, then CRM data, routing and trusted pipeline reporting, then scoring and forecasting. It also covers what to defer, how to read benchmarks, and how to link ad spend to closed-won revenue.
A first RevOps hire should write one stage model, clean CRM data, set routing rules with response-time targets, report pipeline from one source of truth, store click IDs so ad spend ties to closed-won deals, and fix the data foundation before adding AI tools.
RevOps gives a B2B SaaS company one funnel, one set of definitions and one number everyone trusts. The main points to carry forward:
For the next step, read the revenue operations software guide, or bring a funnel, CRM or reporting question to a free consultation: Meet with an expert.
Written by
Ishan Manchanda
Ishan Manchanda is co-founder of GrowthSpree, a B2B SaaS marketing consultancy founded in 2017 that has managed $60M+ in ad spend across 300+ B2B SaaS companies. He focuses on demand generation, go-to-market strategy and pipeline growth, and has been featured in Silicon Valley Times, SaaS Mag and the Unbounce podcast.
© 2026 revopsforb2bsaas.com All rights reserved.


| Sales leadership with RevOps |
| No verified benchmark here; the right ratio depends on deal size, cycle length and win rate |
| Forecast accuracy | Closed-won revenue over the forecast category | RevOps | Published range with no stated sample or source method: commit 85%, best case 38%, weighted pipeline 22% |