
Blog
Last-Touch Attribution: Definition, How It Works, and Where It Breaks Down in B2B SaaS
Last-touch attribution gives 100% of deal credit to the final touchpoint. Learn what it is, how it works, and why it distorts budget decisions in B2B SaaS.
78% of form fills never become SQLs. The shared metrics - cost per SQL, MQL-to-SQL by channel, pipeline coverage - a RevOps dashboard must show both teams.

Last-touch attribution gives 100% of deal credit to the final touchpoint. Learn what it is, how it works, and why it distorts budget decisions in B2B SaaS.

Compare what a revenue operations consultant delivers versus an internal RevOps hire, what must stay in-house, and which path fits a B2B SaaS company at Series A.

Learn what lead routing software does, how lead-to-account matching works, and which criteria separate point solutions from CRM-native routing for B2B SaaS teams.
Request a quote and our experts will contact you within 24 hours with tailored solutions and pricing.
revopsforb2bsaas.com
Last updated: Oct 22, 2026
By the RevOps for B2B SaaS Editorial Team
A marketing reporting dashboard built for revenue operations (RevOps) is a single customer relationship management (CRM)-connected view that surfaces MQL-to-SQL conversion rates by channel, cost per SQL by campaign, pipeline coverage by source, and marketing-influenced pipeline value, so marketing and sales read the same funnel numbers from one report.
The cost of not having one is measurable. Companies with strong sales and marketing alignment achieve 20% annual revenue growth, while misaligned teams see a 4% revenue decline (RevenueMemo, 2026). Yet "92% of B2B marketers admit their pipeline projections lack precision" (RevSure, State of B2B Attribution 2025, via Clicknify, 2026). The root cause is almost always the same: two teams counting different things, from different systems, with different stage definitions.
This page defines the eight metrics a shared marketing reporting dashboard must surface, explains how to calculate each one, and shows how to connect ad spend to closed-won revenue inside the CRM.
Key Takeaways
- 78% of form fills in 104 audited Google Ads accounts never became a sales-qualified lead (SQL), making form fills a misleading metric for both teams (GrowthSpree, June 2026).
- MQL-to-SQL conversion rate by channel belongs on the marketing reporting dashboard: SEO converts at 51%, LinkedIn at 30%, and paid search at 26%, per First Page Sage's June 2025 benchmark of 50+ clients.
- Marketing typically sources 35 to 50% of total pipeline but influences 60 to 85%; reporting only sourced pipeline leaves the influenced share invisible to finance (Dupple, 2026).
- After a 90-day attribution fix across 104 accounts, the share of closed-won deals traceable to a campaign rose from 0% to 67% (GrowthSpree, June 2026).
- Cost per SQL correlated with downstream pipeline at 0.71 across 1,412 ad variants; click-through rate correlated at only 0.09 (GrowthSpree, June 2026).
Marketing and sales report different pipeline numbers because they count different things: marketing counts form fills or marketing-qualified leads (MQLs), while sales counts accepted sales-qualified leads (SQLs). GrowthSpree's audit of 104 Google Ads accounts found that 78% of form fills never became an SQL. Without one written stage definition stored in a shared customer relationship management (CRM) platform, the two numbers will never match.

"If Sales and Marketing aren't measured by the same conversion rates, speed to lead, and retention metrics, they won't align" (RevPartners editorial, 2025). That alignment starts not with a dashboard tool but with a shared definition document. The median sales cycle across those 104 audited accounts was 84 days (GrowthSpree, June 2026). Across a cycle that long, the gap between what marketing counted at the top and what sales accepted at the handoff compounds every week it goes undefined.
The gap between marketing's lead count and sales's lead count almost always traces to one of three causes:
The fix is a shared stage model, written down, with a named entry criterion for each stage tied to a buyer action rather than a seller judgment.
| Stage | Entry Criterion | Who Owns It |
|---|---|---|
| Lead | Form fill or inbound intent signal | CRM automation |
| MQL | Meets defined score or firmographic threshold | Marketing |
| SQL | Sales reviews and accepts against written criteria | Sales |
| Opportunity | Discovery call completed, budget and timeline confirmed | Sales |
| Closed-Won | Contract signed | Sales |
A shared marketing reporting dashboard for B2B SaaS must include five metrics both teams can trace to one CRM report: MQL-to-SQL conversion rate by acquisition channel, cost per SQL by campaign, total open pipeline by stage, pipeline coverage ratio, and marketing-influenced pipeline value. These five connect ad spend to revenue outcomes and eliminate the separate departmental spreadsheets that cause every quarterly disagreement.

First Page Sage's June 2025 benchmark of 50+ clients shows MQL-to-SQL rates ranging from 26% for paid search to 51% for SEO (rahuldsarker.co, 2026). Putting MQL-to-SQL by channel on the marketing reporting dashboard makes that spread visible, rather than hiding it inside an aggregate lead count.
| Metric | Formula | Cadence | Who Uses It |
|---|---|---|---|
| MQL volume by source | Count of MQLs per channel, per period | Weekly | Marketing |
| MQL-to-SQL rate by channel | SQLs divided by MQLs, by source | Monthly | Marketing, Sales |
| Cost per SQL by campaign | Ad spend divided by SQLs produced | Monthly | Marketing, Finance |
| Open pipeline by stage | Sum of opportunity values per stage | Weekly | Sales, RevOps |
| Pipeline coverage ratio | Open pipeline divided by period revenue target | Weekly | Sales, Finance |
| Marketing-sourced pipeline | Value of opportunities where marketing sourced the lead | Monthly | Marketing, Finance |
| Marketing-influenced pipeline | Value of opportunities with any marketing touch in window | Quarterly | Marketing, Finance |
| Win rate by source | Closed-won opportunities divided by total opportunities, by channel | Quarterly | RevOps, Leadership |
MQL-to-SQL conversion rate by channel is the percentage of marketing-qualified leads from each acquisition source that sales accepts as sales-qualified leads. It belongs on the shared marketing reporting dashboard because channel mix determines lead quality, not just volume. First Page Sage's June 2025 benchmark across 50+ clients shows SEO converts at 51%, LinkedIn at 30%, and paid search at 26% (rahuldsarker.co, 2026), so a PPC-heavy campaign produces fewer SQLs at the same MQL volume.
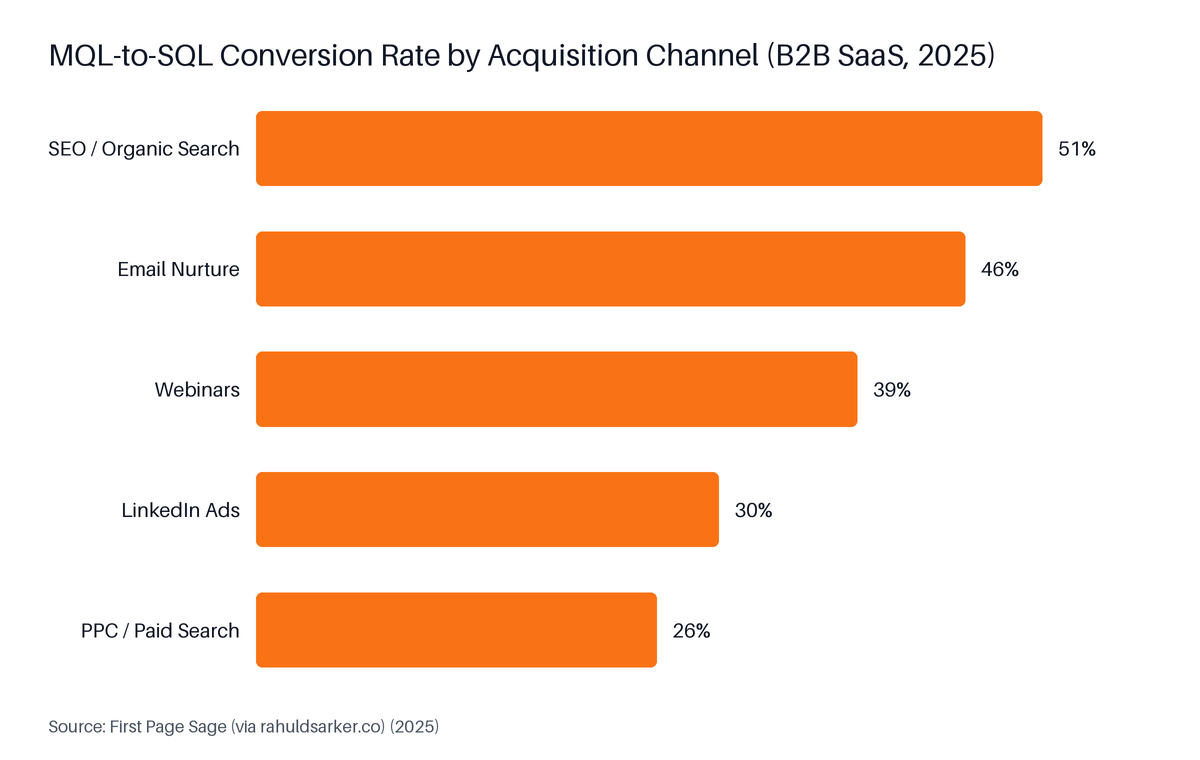
Source: First Page Sage (via rahuldsarker.co), 2025
A separate 2026 benchmark from Flighted, drawing on aggregated B2B SaaS data, puts the overall average MQL-to-SQL rate at 18 to 22%, with top-quartile performers reaching 25 to 35% (Flighted, 2026). GrowthSpree's April 2026 benchmark for B2B SaaS Google Ads specifically gives a median of 13 to 18%. These sources each use different stage definitions and should not be averaged; all three are directional ranges.
When MQL-to-SQL rate by channel is on the dashboard, three questions become answerable in every pipeline review:
GrowthSpree data (June 2026, 1,412 ad variants across 96 accounts): Cost per SQL correlated with downstream pipeline at 0.71, while click-through rate correlated at only 0.09. Optimizing for clicks rather than SQL cost is the mechanical reason campaigns generate form fills that never become revenue.
Cost per SQL is total ad spend divided by the number of sales-qualified leads (SQLs) produced by that spend in the same period. Cost per lead counts every form fill, including the 78% that GrowthSpree's audit of 104 accounts found never becoming an SQL (GrowthSpree, June 2026). GrowthSpree's analysis of 1,412 ad variants found cost per SQL correlated with pipeline at 0.71, while click-through rate correlated at only 0.09.

The median published cost per SQL on Google Ads for B2B SaaS is $800 to $2,500 (GrowthSpree, April 2026). That range reflects differences in industry vertical, deal size, and SQL criteria quality. A team with loose SQL criteria will calculate a low cost per SQL that looks favorable on the marketing reporting dashboard but does not predict revenue. The Flighted 2026 benchmark confirms a wide spread: B2B SaaS MQL-to-SQL averages 18 to 22% overall, with top performers reaching 25 to 35% (Flighted, 2026), which means the denominator in cost-per-SQL calculations varies significantly by SQL criteria stringency.
The calculation requires ad platform spend data and CRM SQL data in the same report. That connection only exists if a click parameter is stored on every lead record, covered in the attribution section below.
Marketing-influenced pipeline is the total value of opportunities where marketing touched the account within a defined attribution window, typically 90 to 365 days before the opportunity was created. In B2B SaaS, marketing typically sources 35 to 50% of total pipeline and influences 60 to 85%, per Dupple's 2026 pipeline benchmark audit (Dupple, 2026). Reporting only marketing-sourced pipeline leaves the influenced share - up to 85% - invisible to finance.
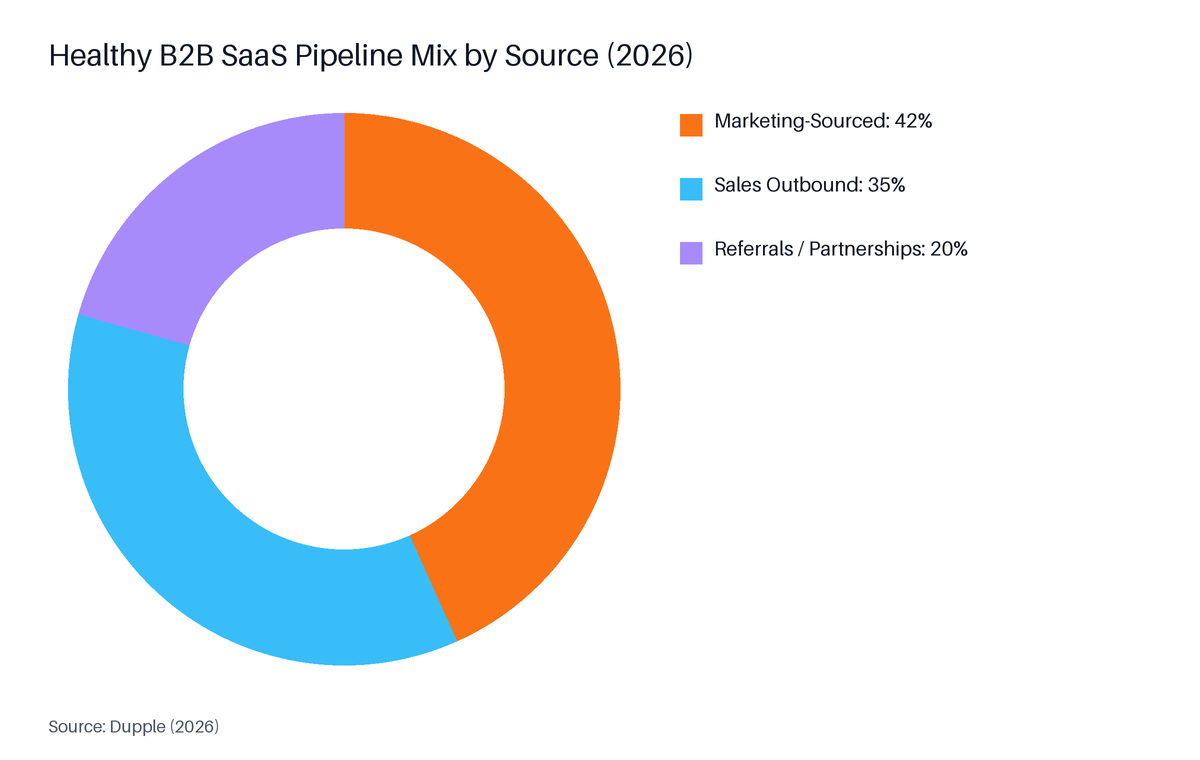
Source: Dupple, 2026
Marketing-sourced pipeline is narrower: it counts only opportunities where marketing generated the first known touch. The distinction matters for finance credibility. As one analyst noted, "Using marketing-sourced pipeline as a KPI oversimplifies the complexity of the B2B buying cycle" (Alison Rouse, VP of Analytics, CS2 Marketing, via ZoomInfo Pipeline). With a median sales cycle of 84 days (GrowthSpree, June 2026), multiple marketing touches across multiple contacts are the norm on any deal of consequence.
GrowthSpree data (June 2026, 104 accounts): After a 90-day attribution fix, the share of closed-won deals traceable to a campaign rose from 0% to 67%. Before the fix, 91% of those accounts had no Google click ID (GCLID) reaching the CRM - making influenced pipeline reporting impossible regardless of the attribution window chosen.
| Pipeline Type | Attribution Window | Reporting Cadence | Finance Audience |
|---|---|---|---|
| Marketing-sourced | First touch only | Monthly | Yes - clear and defensible |
| Marketing-influenced (narrow) | 90 days before opportunity created | Quarterly | Yes, with methodology note |
| Marketing-influenced (broad) | 180 to 365 days before opportunity created | Quarterly | With caveats on window logic |
Finance will accept marketing-influenced pipeline as a proof point when the attribution window is defined in advance and documented. Changing the window retroactively to improve the number destroys credibility with any CFO who checks the methodology.
Marketing attribution tools that trace ad spend to revenue inside the customer relationship management (CRM) platform work by capturing the Google click ID (GCLID) on the lead record at form submission, then following that record to the closed-won opportunity. GrowthSpree's audit of 104 accounts found 91% had no click ID reaching the CRM before remediation. After a 90-day attribution fix, the share of closed-won deals traceable to a campaign rose from 0% to 67% (GrowthSpree, June 2026).

As of September 2025, 27.6% of US marketers rate Marketing Mix Modeling (MMM) their most reliable measurement methodology, overtaking multi-touch attribution (MTA) at 19.4%, with 46.9% planning to invest in MMM in the next year (eMarketer and TransUnion, via AI Digital, 2025). For most B2B SaaS teams in early growth stages, MMM is not yet practical. Getting click IDs into the CRM is the correct first step.
The following steps apply to Google Ads. Equivalent click parameters exist for LinkedIn Ads and Meta Ads.
| Attribution Layer | What It Captures | CRM Dependency | Practical for Early-Stage Teams |
|---|---|---|---|
| Last-touch (native CRM) | Final known touch before form fill | Low | Yes |
| Multi-touch (attribution tool) | All recorded touches in the CRM | High | Yes, with setup |
| Self-reported ("How did you hear about us?") | Buyer's own recollection | None | Yes - add immediately |
| Marketing Mix Modeling | Aggregate spend-to-revenue model | None | Not yet - needs volume |
| Offline conversion upload to Google Ads | Click-to-SQL signal for Smart Bidding | GCLID stored on lead | Yes - prioritize this |
Pipeline coverage by source is the ratio of open pipeline value, broken down by originating channel, to the revenue target for the same period. It belongs on the RevOps dashboard because an aggregate coverage ratio can hide a channel-level gap. Misaligned B2B sales and marketing teams cost companies 10% or more of annual revenue per year, per RevenueMemo's 2026 analysis (RevenueMemo, 2026) - coverage by source makes that gap visible before the quarter closes.

In B2B SaaS, marketing typically sources 35 to 50% of total pipeline, sales outbound roughly 35%, and referrals or partnerships the remainder, per Dupple's 2026 benchmark (Dupple, 2026). When coverage by source sits on the marketing analytics dashboard, the revenue leader can see whether outbound is carrying an unsustainable share of the mix before the quarter ends.
Add conditional formatting or threshold alerts for:
A shared revenue operations (RevOps) marketing reporting dashboard of this design is built for B2B SaaS companies that already have a sales team and a CRM in place. It is not the right starting point for companies with no CRM, no defined funnel stages, or no paid acquisition spend, because the metrics require CRM data to be meaningful. Teams producing fewer than 20 to 30 SQLs per quarter may find channel-level conversion rate breakdowns statistically thin until volume grows.
The eight-metric framework also assumes both marketing and sales have agreed on written stage definitions before the dashboard is built. GrowthSpree's April 2026 benchmark gives a median MQL-to-SQL rate of 13 to 18% for B2B SaaS Google Ads; the Flighted 2026 benchmark puts the overall B2B SaaS average at 18 to 22% (Flighted, 2026). Neither range is meaningful if both teams disagree on what counts as an MQL and an SQL. Stage definitions come first; the dashboard reads from them.
Marketing reporting software should unify the lifecycle stage definition before anything else: one written entry criterion for a marketing-qualified lead (MQL) and one written acceptance criterion for a sales-qualified lead (SQL), stored in the CRM and used by both teams. Without shared definitions, marketing counts form fills and sales counts accepted leads, and the two numbers will never match regardless of which tool is used.
A marketing analytics dashboard built for joint pipeline reviews should surface five metrics both teams can read from the same source: total open pipeline by stage, pipeline coverage ratio, marketing-sourced pipeline value, MQL-to-SQL conversion rate by acquisition channel, and cost per SQL by campaign. Each figure should trace to one CRM report, not a separate spreadsheet per team.
Marketing-influenced pipeline is the total value of opportunities where marketing touched the account within a defined window, typically 90 to 365 days before the opportunity was created. Tag every marketing activity in the CRM against the account record, then filter open and closed-won opportunities by accounts with at least one marketing touch. Report it alongside marketing-sourced pipeline so finance sees both direct and assisted contribution.
Attribution tools that trace ad spend to CRM revenue capture a click parameter - the Google click ID (GCLID) for Google Ads - on the lead record at form fill, then match it to the closed-won deal. The CRM must store the click ID. Native CRM reporting covers last-touch only. Multi-touch coverage requires a dedicated attribution layer that reads the full CRM deal history.
A first revenue operations (RevOps) dashboard for B2B SaaS should track: MQL volume by source, MQL-to-SQL conversion rate by channel, cost per SQL by campaign, open pipeline by stage, pipeline coverage ratio, marketing-sourced pipeline value, marketing-influenced pipeline value, and average sales cycle length. Add win rate by source once enough closed deals exist. These eight metrics give marketing, sales, and finance a shared funnel view.
The argument about whose pipeline number is right ends when both teams read from the same CRM report, built on the same stage definitions. The eight metrics on this marketing reporting dashboard - MQL-to-SQL rate by channel, cost per SQL, pipeline coverage by source, marketing-sourced pipeline, and marketing-influenced pipeline - give marketing, sales, and finance a complete picture of funnel health from ad click to closed-won revenue.
Start with the stage definitions, not the dashboard tool. Write down the MQL entry criteria and the SQL acceptance criteria, put them in the CRM, and make them the entry point for every pipeline review. Then add metrics in order: MQL-to-SQL by channel first, cost per SQL second, pipeline coverage by source third, and influenced pipeline last once the attribution window is agreed with finance.
One funnel. One set of definitions. One number everyone trusts.
Meet with an expert - bring your current dashboard setup and get a clear view of which metrics to add first and in which order.
© 2026 revopsforb2bsaas.com All rights reserved.