
Blog
Sales Conversion Rates in B2B SaaS: Benchmarks by Stage and Channel
B2B SaaS sales conversion rate benchmarks by funnel stage and channel, with source labels that distinguish verified samples from unsampled ranges.
Every marketing attribution model defined - first-touch to data-driven - and how a median 84-day B2B SaaS sales cycle changes which one you should use.

B2B SaaS sales conversion rate benchmarks by funnel stage and channel, with source labels that distinguish verified samples from unsampled ranges.

Learn what attribution models are, how each type works in a B2B SaaS funnel, and what a Series A team needs before any model gives reliable results.
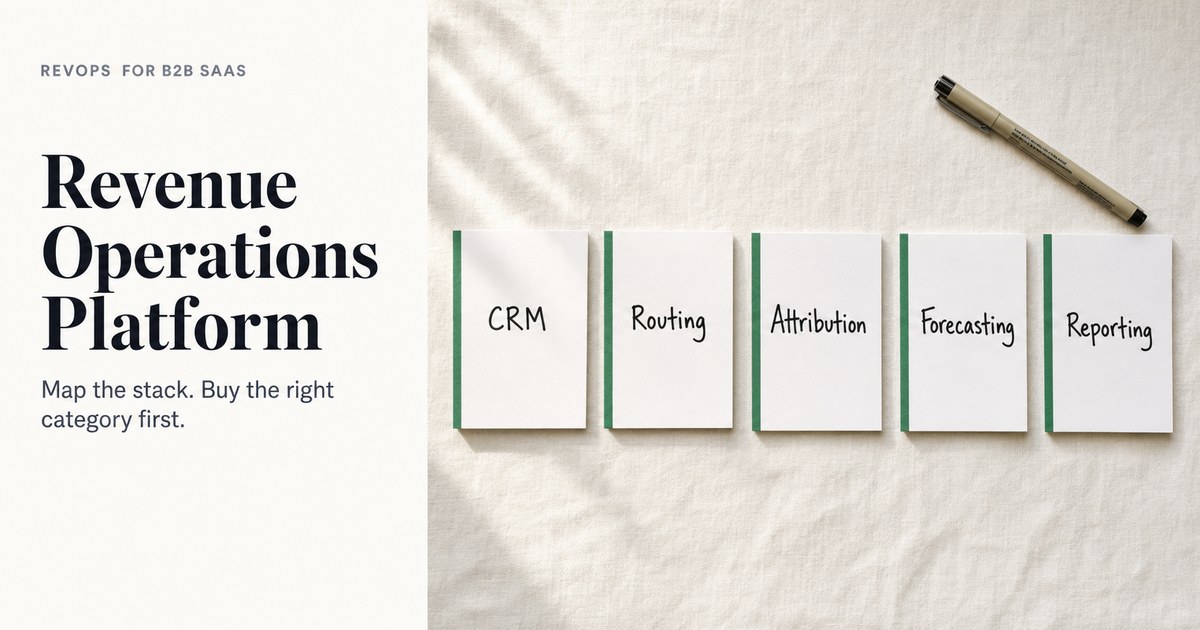
Map every RevOps software category by what it solves, what it misses, and which free tiers exist before a B2B SaaS team can justify paid tools.
Request a quote and our experts will contact you within 24 hours with tailored solutions and pricing.
Last updated: Oct 18, 2026
Marketing attribution models are rules that assign credit for a conversion or closed deal to one or more marketing touchpoints along the buyer's journey, and in B2B SaaS, where the median sales cycle runs 84 days across a committee of stakeholders, the model a team uses determines which campaigns receive budget and which get cut.
Only 21% of B2B marketers say they can measure marketing return on investment with confidence (Demand Gen Report, 2025). The reason is rarely data volume. It is almost always the wrong model applied to the wrong context. A last-touch model on a three-month sales cycle tells you who was in the room at the end. It says nothing about who opened the door.
This guide defines every major attribution model, explains why a long B2B SaaS sales cycle makes model choice consequential, and gives a practical framework for choosing a hybrid approach that revenue operations (RevOps) teams can implement and defend.
Key Takeaways
- Marketing attribution models assign credit for closed deals to specific touchpoints; the model chosen directly shapes budget decisions.
- A median B2B SaaS sales cycle of 84 days, up 22% since 2022, means dozens of touches occur between first contact and closed-won - making single-touch models structurally incomplete (Optif.ai, 2026).
- As of 2024, 35% of B2B SaaS organisations still used last-touch attribution as their primary model (Forrester, 2024).
- GA4's data-driven attribution requires 400 conversions per month from three channels - a threshold most B2B SaaS teams never reach (Google Analytics documentation, as cited by 1ClickReport, 2026).
- A hybrid of multi-touch attribution, self-reported attribution, and branded search lift is rated at 82% to 92% accuracy versus 38% to 58% for a single model - published as opinion with no stated method (GrowthSpree, 2026).
In this guide:
Marketing attribution models are rules that assign credit for a conversion or closed deal to one or more marketing touchpoints along the buyer's journey. In B2B SaaS, where the median sales cycle is 84 days and buying committees average 6.8 stakeholders (Optif.ai, 2026), the model a team chooses determines which campaigns receive budget - making it a consequential operational decision, not a cosmetic reporting preference.

Forrester's 2025 Buyers' Journey Survey found that "73% of purchases involve three or more departments, with an average of 13 people inside the buyer's organization" (Forrester, 2025). Each of those 13 people may interact with a different channel: one reads a case study, another watches a webinar, a third clicks a LinkedIn ad. A model that credits only one of those moments misses the rest of the story.
The practical stakes are direct. When the wrong model drives budget, money flows to the channel that happened to touch last, not the channel that generated intent. Over a 20-month customer acquisition cost (CAC) payback cycle, that error compounds.
Only 21% of B2B marketers say they can measure marketing return on investment with confidence (Demand Gen Report, 2025). That gap is not a tooling problem alone. Many teams have analytics platforms and a customer relationship management (CRM) system but rely on a model built for e-commerce on a sales cycle that looks nothing like e-commerce.
"Marketing attribution is not dead, but single-source, deterministic attribution is," (Geisheker.com, 2026). That shift, from a single deterministic model to a layered approach, is what this guide is built around.
Our data: An audit of 104 Google Ads accounts found that 91% had no Google click ID (GCLID) reaching the CRM, 89% ran default attribution, and 78% of form fills never became a sales-qualified lead (SQL). After a 90-day attribution fix, the share of closed-won deals traced to a campaign went from 0% to 67% (GrowthSpree, June 2026, 104 accounts and $78.0M in spend).
Attribution theory in a marketing context is the body of logic that governs how credit for a conversion is divided across the touchpoints that preceded it, asking which interactions should count and in what proportion. Every named attribution model is an applied answer to those two questions. Yet only 21% of B2B marketers say they can measure marketing ROI with confidence (Demand Gen Report, 2025), a gap that traces directly to model assumptions that do not match B2B buying reality.
The term originates in social psychology, where it describes how people assign causes to events. In marketing, the "event" is a purchase decision and the "causes" are the channels, campaigns, and content a buyer encountered. Attribution theory does not prescribe a single right answer. It provides a framework for making the assumptions explicit so they can be examined and adjusted when conversion rates or pipeline health changes.
Every model sits somewhere on two axes:
Understanding these two dimensions makes it possible to evaluate any model, including proprietary vendor models, without memorising each one as a separate category. First-touch and last-touch are single-touch, maximum-concentration models. Linear is multi-touch with equal weighting. Time-decay is multi-touch with recency weighting. Data-driven is multi-touch with algorithmic weighting. Self-reported sits outside the tracking layer entirely and captures intent that the other models cannot reach.
The six principal marketing attribution models are first-touch, last-touch, linear, time-decay, data-driven, and self-reported. Each assigns conversion credit differently: first-touch gives 100% to the first interaction; last-touch gives 100% to the final one; linear splits credit equally; time-decay weights recent touches more heavily; data-driven uses algorithmic weighting; and self-reported asks the buyer directly. As of 2024, 35% of B2B SaaS organisations still used last-touch as their primary model (Forrester, 2024).
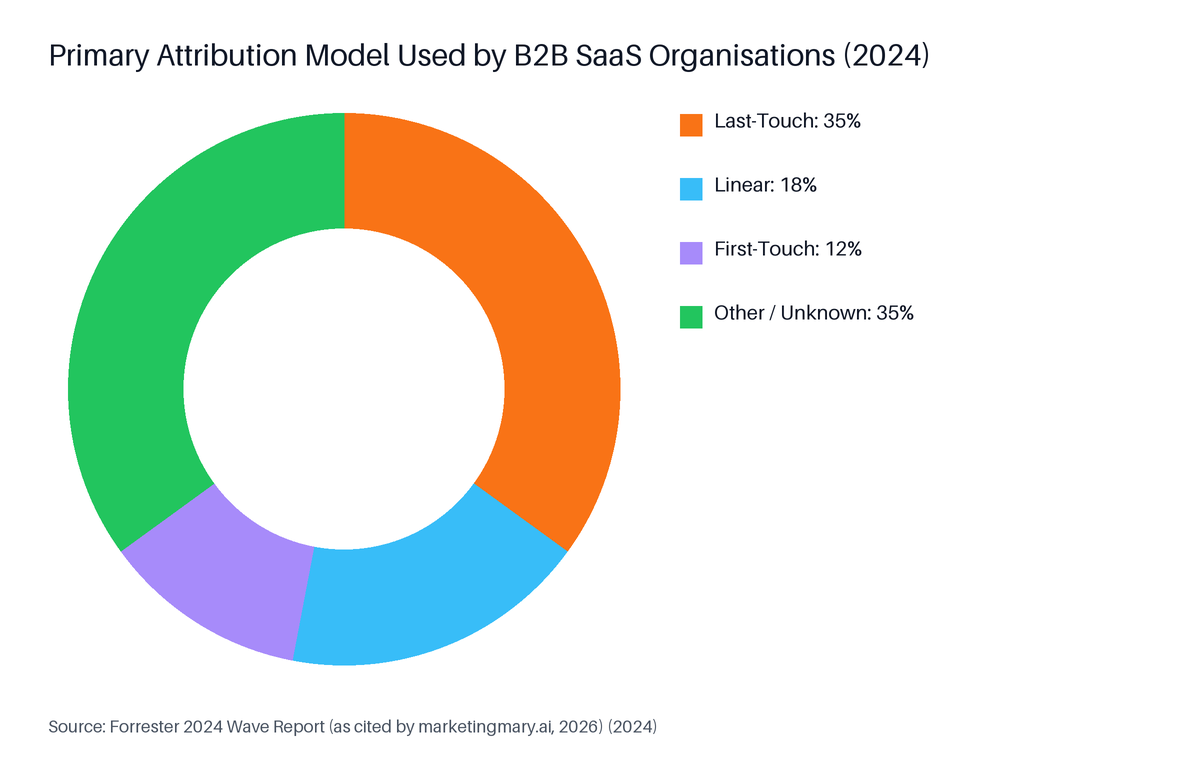
Source: Forrester 2024 Wave Report (as cited by marketingmary.ai, 2026), 2024
The table below summarises each model's credit logic, its primary strength, and its main failure point for long B2B cycles.
| Model | Credit Logic | Primary Strength | Main Failure for B2B SaaS |
|---|---|---|---|
| First-touch | 100% to first interaction | Identifies top-of-funnel demand sources | Ignores all nurture and closing activity |
| Last-touch | 100% to final pre-conversion touch | Simple; maps to CRM default | Over-credits branded search and demo pages |
| Linear | Equal split across all touches | Broad channel visibility | Treats a brand podcast and a demo equally |
| Time-decay | More credit to recent touches | Acknowledges closing-stage influence | Still under-credits awareness channels |
| Data-driven | Algorithmic weighting by conversion probability | Most statistically accurate where data is sufficient | Requires 400+ conversions/month; unavailable to most B2B teams |
| Self-reported | Buyer's own stated channel | Captures dark funnel; brand and word-of-mouth | Recall bias; qualitative rather than deterministic |
First-touch attribution is a model that assigns 100% of conversion credit to the very first interaction a lead had with the company. Its value is narrow: it tells demand-generation teams which channel opened the relationship. It is blind to everything that happened next.
Last-touch attribution assigns 100% of credit to the final touchpoint before a conversion. It is the default in most CRM systems. Because branded search often appears at the end of a long research journey, last-touch routinely over-credits it - a dynamic practitioners describe as branded search getting credit for everything. Google moved to data-driven attribution as the default in Google Ads and removed first-touch, linear, time-decay, and position-based models from the platform in late 2023; last-click remains as the fallback below the data-driven threshold.
Linear attribution divides credit equally across every recorded touchpoint. It surfaces channels that would otherwise be invisible under first-touch or last-touch, but treats every touch as equally influential regardless of where it sits in the journey or how long the buyer engaged.
Time-decay attribution gives more credit to touchpoints that occurred closer to the conversion date, on the assumption that recent interactions had more influence. For a short e-commerce funnel that logic has some plausibility. Across an 84-day B2B SaaS cycle with months of nurture between an awareness event and a signed contract, it still systematically under-credits upper-funnel work.
Data-driven attribution (DDA) uses machine learning to assign credit weights based on each touchpoint's statistical contribution to conversion outcomes. It is the most theoretically sound model - and the most restricted in practice. The dedicated section below covers its GA4 threshold requirements.
Self-reported attribution collects buyer intent data directly from the buyer, usually through a form field asking how they heard about the company. It is the only model that can capture dark-funnel activity: a podcast mention, a Reddit thread, a word-of-mouth referral, or a recommendation from a large language model AI tool. It is covered in depth in its own section below.
A median B2B SaaS sales cycle of 84 days - up 22% since 2022-means dozens of touchpoints occur between a buyer's first interaction and a closed deal. Buying committees now average 6.8 stakeholders, up from 5.4 in 2020 (Optif.ai, 2026). Assigning all credit to one touch ignores the content, ads, and conversations that moved the deal forward across three months, which is why single-touch models produce structurally incomplete attribution for most B2B SaaS teams.

"Sales cycles have lengthened 22% since 2022, driven by larger buying committees (6.8 stakeholders, up from 5.4)," (Optif.ai Pipeline Study 2026, 2026). The chart below shows how cycle length varies across B2B industries.
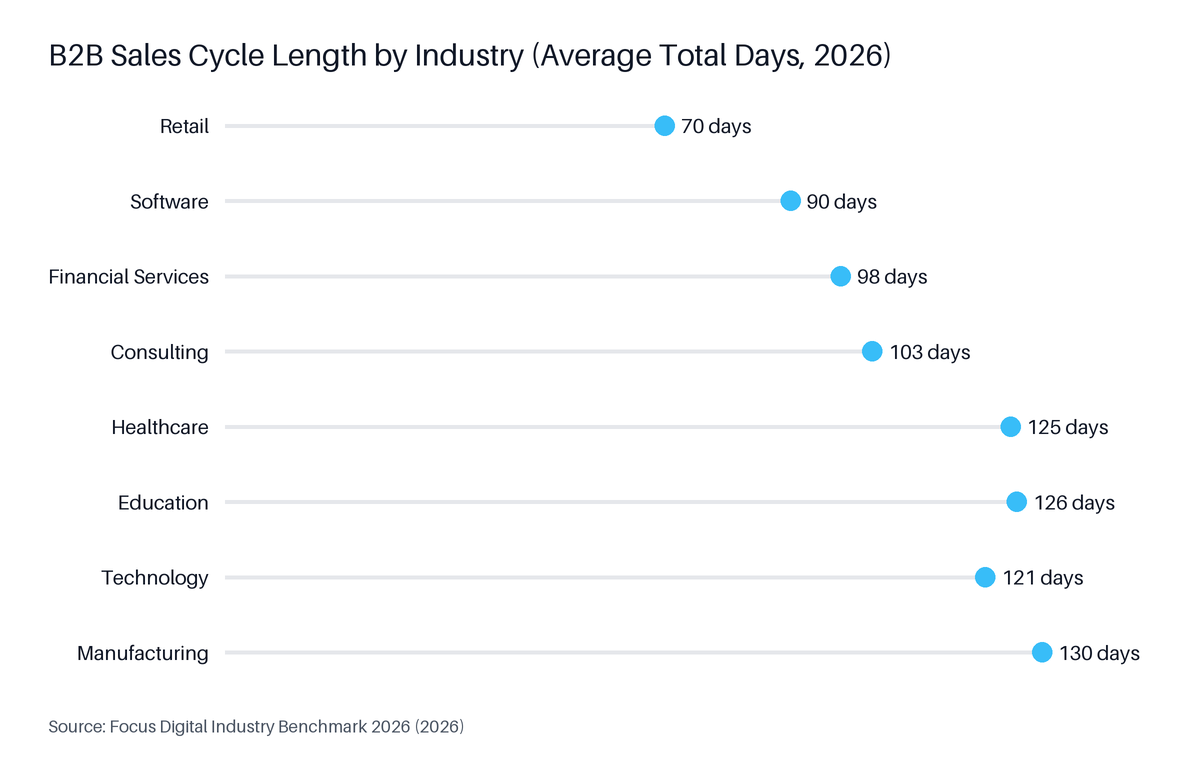
Source: Focus Digital Industry Benchmark 2026, 2026
Single-model attribution is rated at 38% to 58% accuracy in published opinion with no stated method (GrowthSpree, 2026). A hybrid approach is rated at 82% to 92% in the same source - also with no stated method. Both figures are labeled here explicitly as opinion, not findings.
When 73% of purchases involve three or more departments (Forrester, 2025), each stakeholder in a buying committee may enter the funnel at a different point and through a different channel. A single-touch model on a single contact's record cannot represent a committee. It records one person's last Google search before the contract was signed.
The structural result: paid search bottom-of-funnel gets the conversion. The LinkedIn campaign that ran three months earlier, the blog post the security lead shared internally, and the webinar the CFO attended before approving the budget all receive zero credit.
A practical complication compounds the model problem. Browser cookies used to stitch sessions together typically expire after 30 to 90 days. On an 84-day median cycle, a portion of first-touch data is structurally lost before the deal closes, even in platforms that support multi-touch tracking. Multi-touch models undercount upper-funnel touches not because buyers did not have them, but because the tracking infrastructure expired before the sale completed.
Data-driven attribution (DDA) uses machine learning to weight touchpoints by their statistical contribution to conversions, rather than applying a fixed rule. In Google Analytics 4, DDA requires a minimum of 400 conversions per 30-day period from at least three traffic channels; below that threshold GA4 silently reverts to last-click (Google Analytics documentation, as cited by 1ClickReport, 2026). Most B2B SaaS companies with long cycles and low monthly conversion volume fall below this threshold and are excluded structurally.

Google removed first-touch, linear, time-decay, and position-based models from Google Ads in late 2023. Only data-driven and last-click remain available inside Google Ads natively. Teams that previously ran linear or time-decay models are now on last-click or DDA by default, whether they chose to be or not. Google Analytics 4 launched its Conversion Attribution Analysis Report in February 2026, providing assisted-conversion and funnel-stage touchpoint data natively - but the 400-conversion floor still applies for DDA to activate.
For a B2B SaaS company generating 40 to 80 form fills per month with a 13% to 18% marketing-qualified lead (MQL) to sales-qualified lead (SQL) conversion rate (GrowthSpree, April 2026), the qualified conversion volume feeding GA4's DDA model may be a handful of events per month. DDA does not activate. The fallback is last-click. The team sees last-click data with no indication that DDA failed to fire, and makes budget decisions accordingly.
The practical implication: teams that cannot meet the DDA data threshold need a third-party multi-touch attribution tool, a self-reported attribution layer, or both.
Self-reported attribution is a method that asks buyers directly - via a how-did-you-hear-about-us (HDYHAU) form field - which channel or source influenced their decision. It captures dark-funnel activity that tracking pixels and UTM parameters cannot reach. A HockeyStack study of 600+ B2B companies found that 41% of closed-won deals credited a channel their multi-touch model gave less than 5% credit to (HockeyStack, as cited by Ziellab, 2024), illustrating the gap self-reported data is designed to close.

"Buyers misremember specific touchpoints, but they reliably name the channel that influenced them most," (Ziellab / Peec AI, 2026). Self-reported data is not a precise log of every interaction. It is a directional signal about which channel carried the most weight - which is often more useful than a precise log that credits branded search with everything.
Self-reported attribution data should not replace multi-touch tracking. It adds a qualitative layer that answers a different question. UTM and Google click ID (GCLID) tracking answers "which click brought this lead in?" HDYHAU data answers "which channel made this buyer trust us enough to book a demo?" Both questions matter for B2B SaaS budget decisions.
Customer acquisition cost (CAC) is total sales and marketing spend divided by the number of new customers acquired in the same period. When attribution is wrong, the campaigns credited with winning customers are wrong too - so CAC calculations mislead budget decisions. Median B2B SaaS CAC reached $1,200 per customer in 2026, with a median payback period of 20 months (Data-Mania, 2026). Misattributing spend across a 20-month payback window compounds allocation errors across multiple quarters.
Google Ads costs per click have risen 164% since 2019; LinkedIn Ads costs per click have risen 89% over the same period (Data-Mania, 2026). At a published median cost of $800 to $2,500 per SQL on Google Ads (GrowthSpree, April 2026), misallocating budget toward last-touch-credited campaigns that did not generate demand is a costly error.
Our data: After a 90-day attribution fix across 104 audited Google Ads accounts, the share of closed-won deals traced to a campaign went from 0% to 67%. Before the fix, 89% of accounts ran default attribution and 91% had no GCLID reaching the CRM. Cost per SQL tracked pipeline at a correlation of 0.71 across 1,412 ad variants; click-through rate tracked at only 0.09 (GrowthSpree, June 2026).
A CAC figure that does not break down by channel is an average of very different costs blended together. Paid search, LinkedIn, SEO, and content all carry different cost structures and different conversion rates. MQL-to-SQL conversion rates vary from 26% for paid search and 30% for LinkedIn to 51% for SEO across 50+ clients (First Page Sage, updated June 11, 2025). A separate benchmark gives a median of 13% to 18% for B2B SaaS Google Ads specifically (GrowthSpree, April 2026). The two sources define stages separately and are not averaged here.
When the attribution model gives last-touch credit to branded search for all conversions, the cost-per-SQL and CAC figures for LinkedIn, content, and SEO disappear from the report. The channels that built the pipeline receive no measurable credit, and the channels that captured the intent appear to be the only thing working.
No single attribution model gives a complete picture for a B2B SaaS company with a long sales cycle and a multi-stakeholder buying committee. A practical hybrid combines multi-touch attribution for digital touchpoints, self-reported attribution for dark-funnel and brand-influenced channels, and branded search lift analysis for upper-funnel effect. Starting point depends on monthly conversion volume: teams below 400 conversions per month cannot use GA4's data-driven model and should rely on a third-party multi-touch tool or the hybrid approach described here.
As of 2026, 75% of companies have adopted multi-touch attribution (MTA), up from 58% in 2024, and teams implementing MTA report 14% to 36% cost-per-acquisition improvement and an average 19% return on investment lift in the first year (Improvado, 2026).
The table below maps team profile to a recommended starting point. Use it as a starting position, not a prescription - every stack should be reviewed as conversion volume and tooling change.
| Company Profile | Monthly Conversions | Recommended Approach |
|---|---|---|
| Early-stage, single paid channel | Under 50 | Last-touch in CRM + HDYHAU field on all forms |
| Growth-stage, 2-3 channels | 50-200 | Third-party MTA tool + HDYHAU field + UTM discipline |
| Scale-stage, 4+ channels | 200-400 | Third-party MTA tool + HDYHAU + branded search lift analysis |
| High-volume, 400+ conversions/month | 400+ | GA4 DDA (if 3+ channels) + third-party MTA + HDYHAU |
| Account-based (ABM) motion | Any | Account-level MTA + HDYHAU at opportunity stage |
A functional hybrid attribution stack for B2B SaaS has three layers:
None of these layers is optional if the goal is to defend a marketing budget against a CFO or board that asks which channel drove closed-won revenue.
The attribution frameworks on this page assume a customer relationship management (CRM) system is in place, click parameters are stored with lead records, and at least one paid or owned digital channel is running. Teams with no CRM, no UTM discipline, or fewer than a handful of monthly conversions will find multi-touch and data-driven models inapplicable. Self-reported attribution works at any volume but requires a consistent form field and a regular review cadence to produce usable data.
This guidance also does not apply to B2C, direct-to-consumer, or e-commerce companies, where buying committees, 84-day cycles, and dark-funnel enterprise research dynamics are structurally different. The model logic and measurement infrastructure diverge significantly enough that the recommendations here do not transfer.
Finally: attribution data tells you which channels correlated with closed-won deals. It does not prove causation. A branded search click appearing as the last touch before a signature did not necessarily cause the deal - it may have been the final step in a journey that started with a podcast three months earlier. Treat attribution data as a directional signal that informs budget decisions, not as proof of what caused the sale.
Marketing attribution is the practice of identifying which channels, campaigns, or touchpoints contributed to a conversion or closed deal, and assigning credit to each. In B2B SaaS, where "73% of purchases involve three or more departments, with an average of 13 people inside the buyer's organization" (Forrester, 2025), attribution answers the question: which marketing activity actually drove revenue, and how much of it?
Lead attribution is the process of recording which channel or campaign generated a specific lead and tracing that lead through the funnel to a closed deal. It is measured by storing a click parameter - such as the Google click ID (GCLID) - with every lead record in the CRM, tagging form submissions with UTM parameters, and mapping those fields to revenue outcomes at the deal or opportunity level. An audit of 104 accounts found 91% had no GCLID reaching the CRM before a fix was applied (GrowthSpree, June 2026).
Customer acquisition cost (CAC) is total sales and marketing spend divided by the number of new customers acquired in the same period. Median B2B SaaS CAC reached $1,200 per customer in 2026, with a median payback period of 20 months (Data-Mania, 2026). Attribution directly affects CAC by determining which campaigns are credited with acquiring each customer - which in turn drives where budget goes next.
Marketing attribution models are not a reporting detail. They are the mechanism that connects marketing spend to revenue. In a B2B SaaS company with an 84-day median sales cycle and a buying committee of 6.8 stakeholders, the model a team uses will systematically under-credit some channels and over-credit others unless it is built for that context.
Five things to carry forward:
The next step is infrastructure: store the GCLID on every lead record, add a HDYHAU field to every form, and send qualified stages back to your ad platform as offline conversions. That foundation makes every model more useful.
Ready to connect your ad spend to closed-won revenue? Meet with an expert for a free consultation on attribution setup, CRM configuration, and offline conversion tracking.
By the RevOps for B2B SaaS Editorial Team. This guide covers revenue operations, funnel definitions, CRM setup, attribution, and the metrics a board asks for. Every figure names its source; ranges with no stated sample or method are labeled explicitly. Last updated: October 13, 2026.
© 2026 revopsforb2bsaas.com All rights reserved.